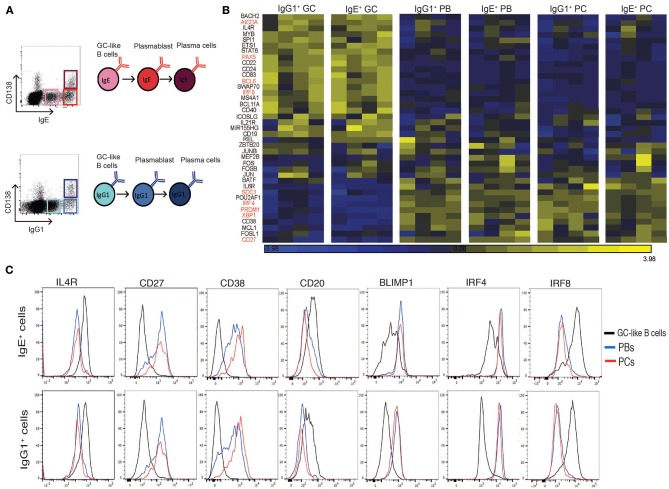
Figure 1.
Expression profile of GC and PC associated genes in sorted IgE+ and IgG1+ cell populations. (A) IL-4 and anti-CD40 stimulated tonsil B cells were harvested on day 10 of the culture and surface stained for CD138, intracellular IgE and IgG1 and FACS sorted into GC B cells (IgElo CD138− and IgG1lo CD138−), PBs (IgEhi CD138− and IgG1hi CD138−), and PCs (IgEhi CD138+ and IgG1hi CD138+). (B) Heatmap of GC and PC associated genes in each of the sorted IgE+ and IgG1+ cell populations. Each column represents the gene expression profiles of the different phenotypic cell populations sorted from four different tonsil B cell cultures. (C) Flow cytometric validation of seven differentially expressed genes in IgE+ and IgG1+ cell populations. Data are representative of 6 experiments.

