Figure 3.
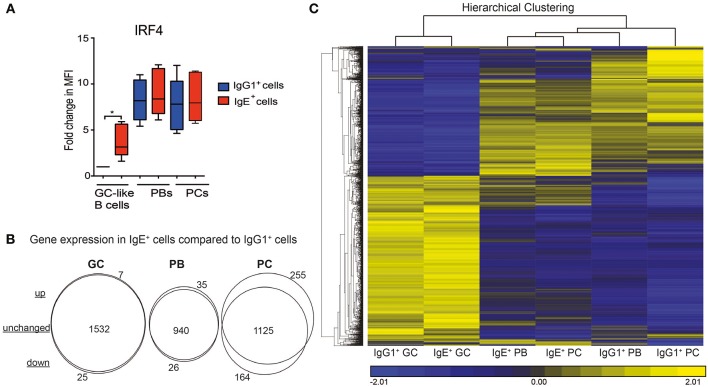
The relationship between the IgE+ and IgG1+ cells along their differentiation pathway. (A) Expression levels of IRF4 in IgE+ and IgG1+ cells as determine by flow cytometry. Data show the fold change in median fluorescence intensity (MFI) of anti-IRF4 stained cells relative to IgG1+ GC-like B cells (n = 6). Statistical analysis was performed using the One-Way ANOVA, Dunnett's test (*P < 0.05). (B) Visualization of gene expression differences between IgE+ and IgG1+ cells along their PC differentiation pathway. Genes differentially expressed (>1.5-fold, p < 0.05) at each IgE+ and IgG1+ cell differentiation stage underwent a 2-way ANNOVA analysis. The number of genes that were significantly (p < 0.05) up-regulated or down-regulated by >1.5-fold in IgE+ cells compared to IgG1+ cells at GC, PB, and PC are highlighted by the Venn diagrams. (C), Unsupervised K-means hierarchical clustering of all genes differentially expressed in IgE+ and IgG1+ cells along their differentiation pathway. Each column represents the mean gene expression profile from all four donors of the specified phenotypic group.

