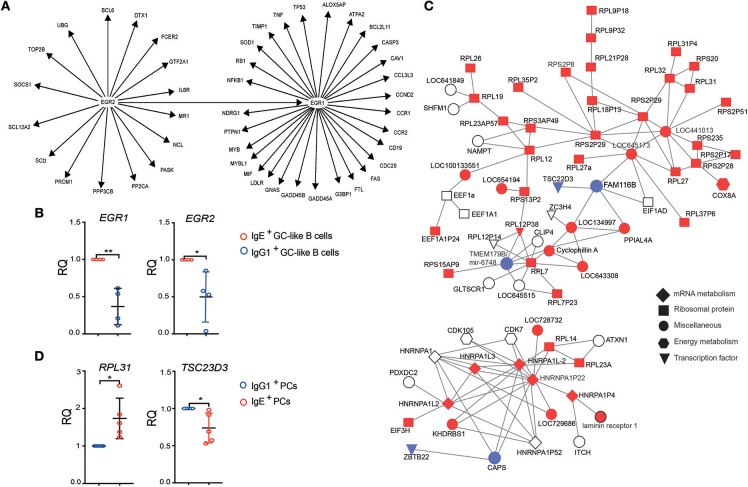
Figure 4.
Identification of gene interaction and co-expression networks associated with IgE+ PC differentiation. (A) IPA was performed on genes that were differentially expressed between IgE+ and IgG1+ cells (>1.5-fold and P < 0.05). The gene network was identified based on the literature contained in the IPA knowledge database. Target genes of the EGR1 and EGR2, shown in the figure, were found to be differentially expressed by more than 1.5-fold (P < 0.05) either in IgE+ and IgG1+ GC-like B cells compared to PBs or PCs or in IgE+ cells compared to IgG1+ cells along their PC differentiation pathway. (B) RT-PCR validation of EGR1 and EGR2 expression in IgE+ and IgG1+ GC-like B cells. Data represent the mean +/– SD of the relative quantification (RQ). Statistical analysis was performed using the t-test with Welch's correction (*P < 0.05, **P < 0.01). (C) Identification of a module of highly correlated genes, by WGCNA analysis encoding a large number of ribosomal proteins, that is enriched in IgE+ PCs. In total this network contains 547 genes, however, to improve network visibility only those with a weight above 0.075 are shown. This de-novo co-expression network was negatively correlated with the IgG1+ PCs (correlation coefficient −0.65, p = 0.003). The genes up-regulated (red) or down-regulated (blue) by more than 1.3-fold in IgE+ PCs compared to IgG1+ PCs, whereas genes with <1.3-fold difference are shown as uncolored. The shape of each node reflects the biological function of each gene, as determined by GO analysis. More detailed information about the top candidate genes displayed in the network can be found in the Supplementary Table 4. (D) RT-PCR validation of RPL31, which is up-regulated, and TSC23D3 that is down-regulated in IgE+ and IgG1+ PCs. Data represent the mean +/– SD of the relative quantification (RQ). Statistical analysis was performed using the unpaired t-test with Welch's correction (*P < 0.05, **P < 0.01).

