Figure 6.
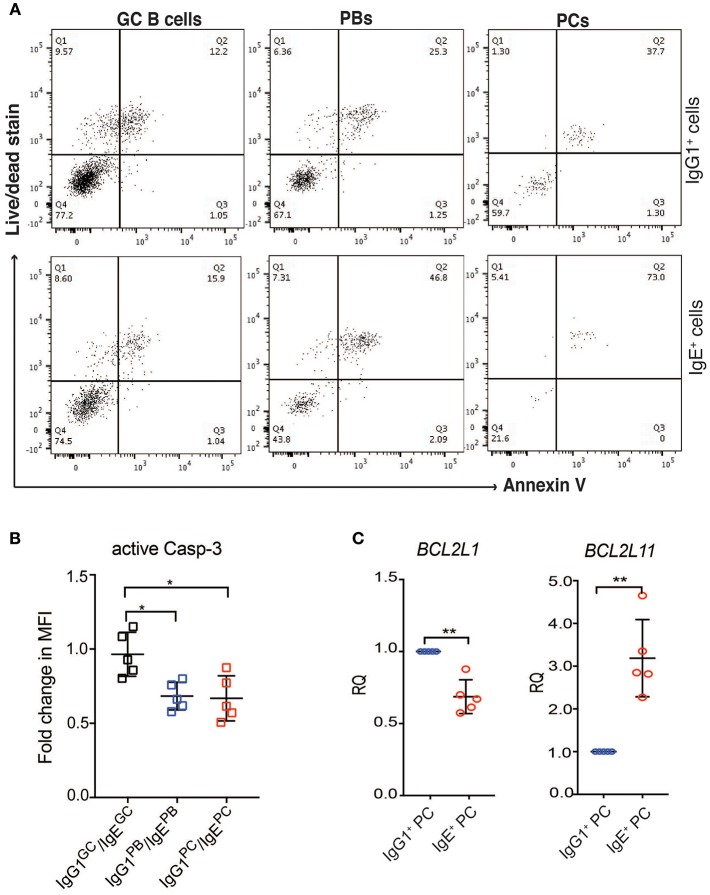
IgE+ PCs have increased rates of apoptosis compared to IgG1+ PCs. (A) After 24 h of reculture with IL-4 and anti-CD40, the IgE+ and IgG1+ cells were stained with annexin V and a live/dead fixable dye. The lower left quadrant within each dot plot (negative for Annexin V and live/dead stain) corresponds to the viable cells and the data shown are representative of three different experiments. (B) On day 10 of the culture, the activity of Caspase 3 was determined by staining with anti-active Caspase 3 antibody. The data show the fold change in MFI of active Caspase 3 within each IgG1+ cell population made relative to their respective IgE+ cell counterparts. Statistical analysis was performed using the one way ANNOVA test with Bonferroni correction (*P < 0.05). (C) RT-PCR validation of BCL2L11 and BCL2L1 expression in IgE+ and IgG1+ PCs. Data represent the mean +/– SD of the relative quantification (RQ). Statistical analysis was performed using the unpaired t-test with Welch's correction (*P < 0.05, **P < 0.01).

