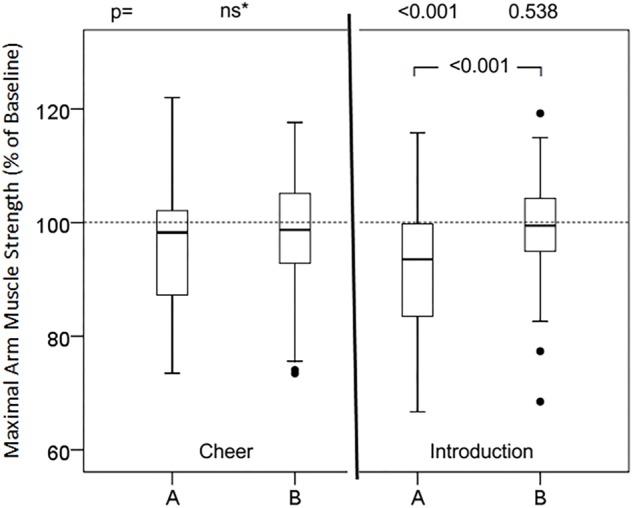
FIGURE 2.

Effects of cheer and introduction in two versions on maximal arm muscle strength. After baseline dynamometry of arm abduction a sentence of cheer or introduction was presented and maximal muscle strength measured again. Box- plot diagrams of relative values are given, comparing version A and version B with the baseline value and versions A and B among each other. ∗Friedman test; ns, not significant; p, according to Wilcoxon test.
