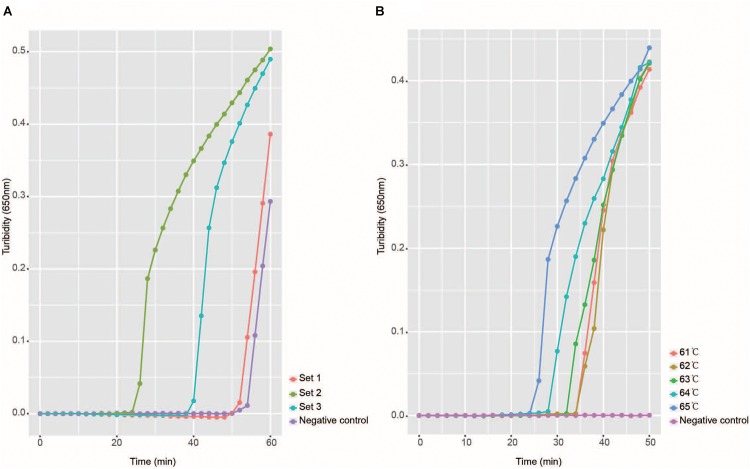
FIGURE 2.
Selection of optimal reaction conditions. Panel A shows the turbidity signals of the three candidate primer sets, which indicate that the set two primers were optimal. This set of primers was used in all later studies. Panel B shows the temperature selection results, and the turbidity at each temperature is shown in a different color.

