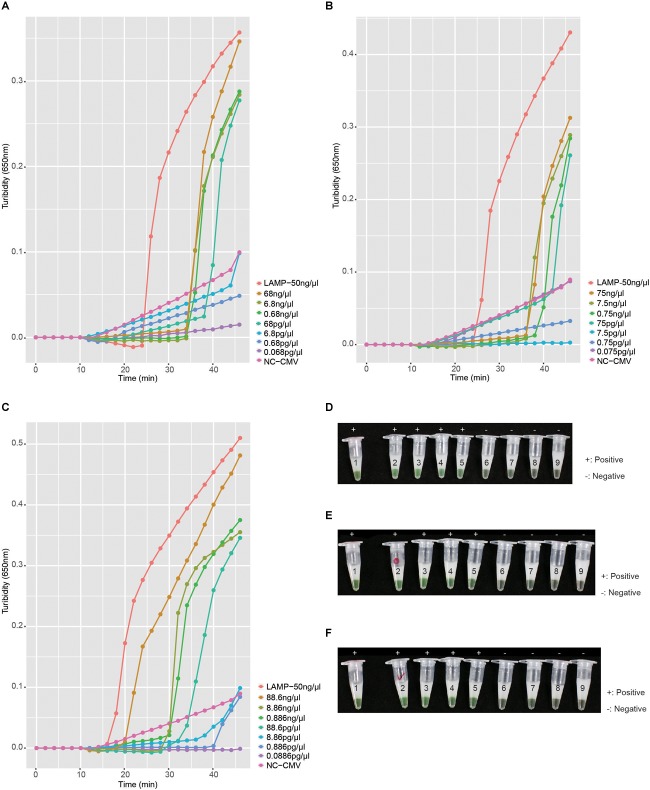
FIGURE 4.
Sensitivity of the RT-LAMP assay. Panels A–C show the turbidity in the RT-LAMP sensitivity tests for pha-NiV-BN, pha-NiV-MN, and pha-NiV-TN, respectively. LAMP-50 ng/μl of each panel represents the positive controls: pUC57-NiV-BN (50 ng/μl), pUC57-NiV-MN (50 ng/μl), and pUC57-NiV-TN (50 ng/μl), respectively. Negative control (RNA from the cell extract transfected with pHAGE-CMV-MCS-IZsGreen vector) in each panel is marked with NC-CMV and the concentrations tested in each RT-LAMP reaction are listed on the right of each panel. Panels D–F show the chromogenic test results for the RT-LAMP detection of pha-NiV-BN, pha-NiV-MN, and pha-NiV-TN, respectively, with 1 μl of calcein indicator. Numbers on the tubes of each panel correspond to the legends in panels A–C, respectively. Positive results are marked “+” and negative results are marked “−.”

