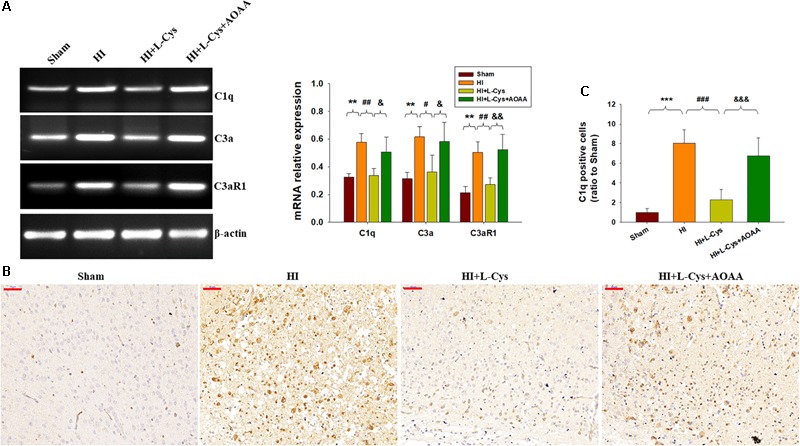
FIGURE 3.

L-Cys suppressed HI-induced C1q, C3a, and C3aR1 expression in the ipsilateral cortex at 72 h post-HI. (A) Representative RT-PCR photographs showing mRNA levels of C1q, C3a, and C3aR1 within the ipsilateral cortex. Quantitative results of relative mRNA levels among the different groups. Values were normalized to β-actin. N = 4 mice/group. (B) Representative photographs of C1q staining within the ipsilateral cortex as taken at 72 h following HI. Scale bar = 50 μm. (C) Quantification of C1q+ cells. N = 6 mice/group. Values represent the mean ± SD, ∗∗p < 0.01, ∗∗∗p < 0.001 HI vs. Sham; #p < 0.05, ##p < 0.01, ###p < 0.001 HI + L-Cys vs. HI; &p < 0.05, &&p < 0.01, &&&p < 0.001 HI + L-Cys + AOAA vs. HI + L-Cys.
