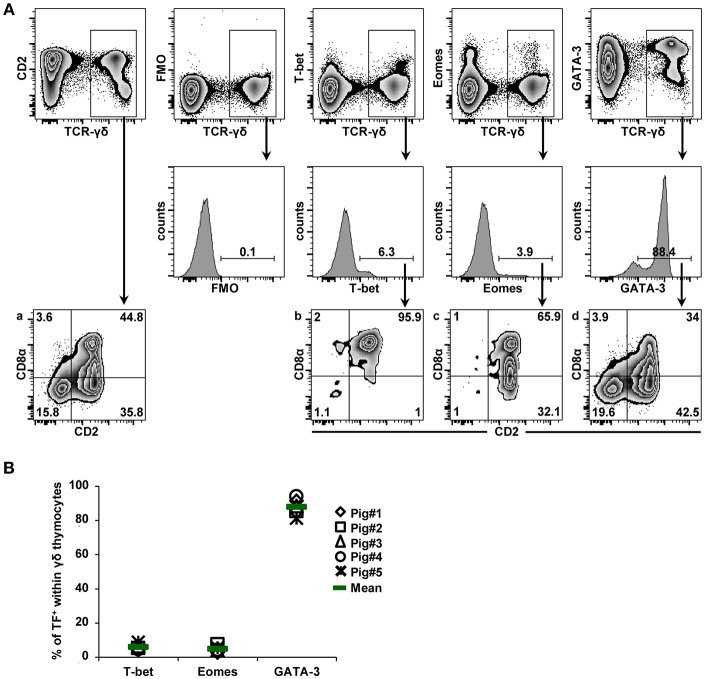
Figure 1.
Expression of T-bet, Eomes and GATA-3 in γδ thymocytes. (A) Following exclusion of dead cells (not shown), total TCR-γδ+ thymocytes were gated (top row) and analyzed for the expression of T-bet, Eomes and GATA-3 (histograms, second row). Total TCR-γδ+ thymocytes and TF-expressing TCR-γδ+ thymocytes were further analyzed for expression of CD2 and CD8α (third row, zebra plots denoted “a,” “b,” “c,” “d”). Numbers indicate the percentage of transcription factor expressing γδ thymocytes (histograms) or percentage of CD2/CD8α-defined subsets (zebra plots, third row). Data from one representative animal out of five are shown. (B) The scatter diagram shows the frequency of T-bet, Eomes and GATA-3 expressing γδ thymocytes. Each symbol represents data of one individual animal (n = 5). Green bars indicate mean values.

