Figure 12.

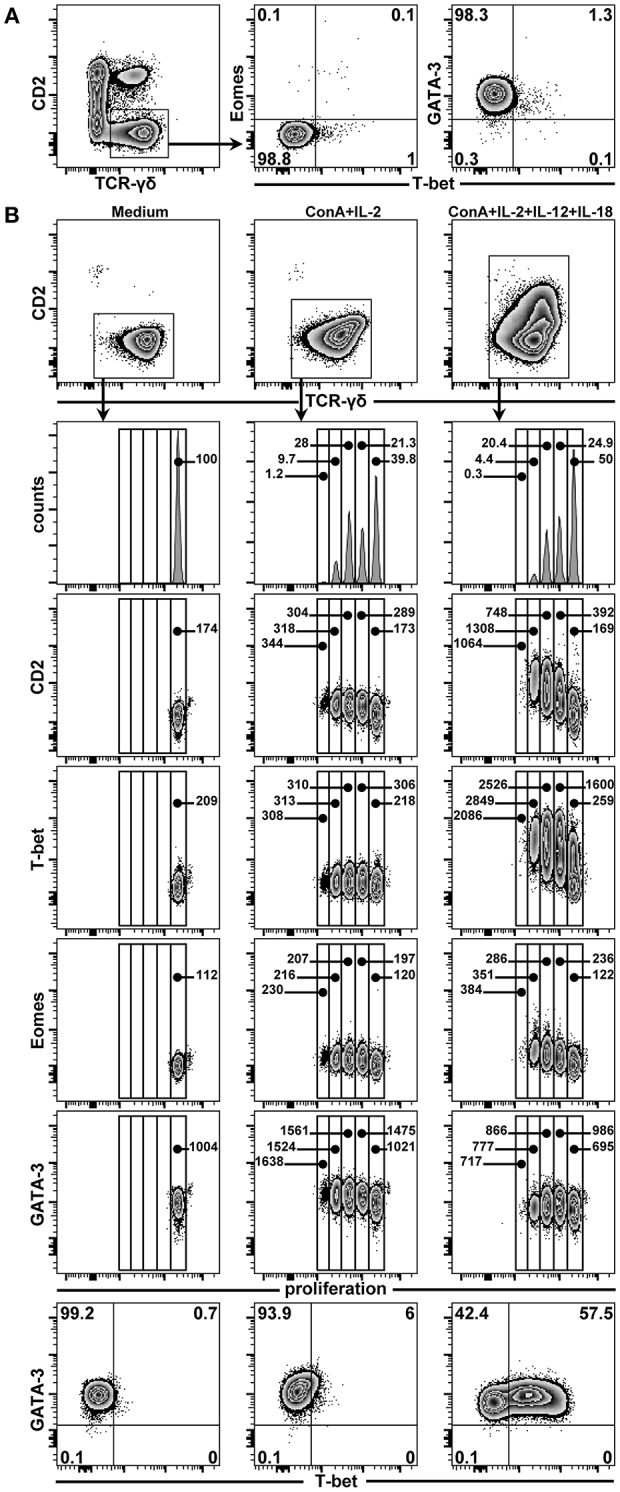
Influence of ConA and cytokine stimulation on proliferation and TF expression in CD2− γδ T cells. (A) PBMCs isolated from blood of 7-month-old pigs were stained for TCR-γδ and CD2 expression and CD2− γδ T cells were sorted by FACS (illustrated in zebra plots). Following sorting, CD2− γδ T cells were analyzed for purity (not shown) and expression of T-bet in combination with either Eomes or GATA-3 (zebra plots). Numbers in the corners show percentage of cells with the respective phenotype. (B) In parallel, FACS-sorted CD2− γδ T cells were stained with CellTrace™ Violet and cultivated in medium (first column) or stimulated with ConA + IL-2 (second column) or ConA + IL-2 + IL-12 + IL-18 (third column). After 4 days of cultivation, these cells were re-stained for TCR-γδ and CD2 expression, gated (zebra plots, top panel), and proliferation in combination with CD2 and the transcriptions factors T-bet, Eomes and GATA-3 was analyzed (histograms and subsequent zebra plots). Additionally, expression of T-bet vs. GATA-3 is shown for each stimulation condition (last row). Numbers in the histograms give the percentage of cells in each generation, as determined by dilution of the violet proliferation dye. Numbers in zebra plots give the median fluorescence intensity for CD2, T-bet, Eomes, and GATA-3 (third to fourth row of zebra plots, respectively) of cells in each generation. Numbers in the corners of zebra plots at the bottom show percentage of cells with the respective phenotype. The data shown are representative of three experiments with PBMCs from three different pigs.
