Figure 2.
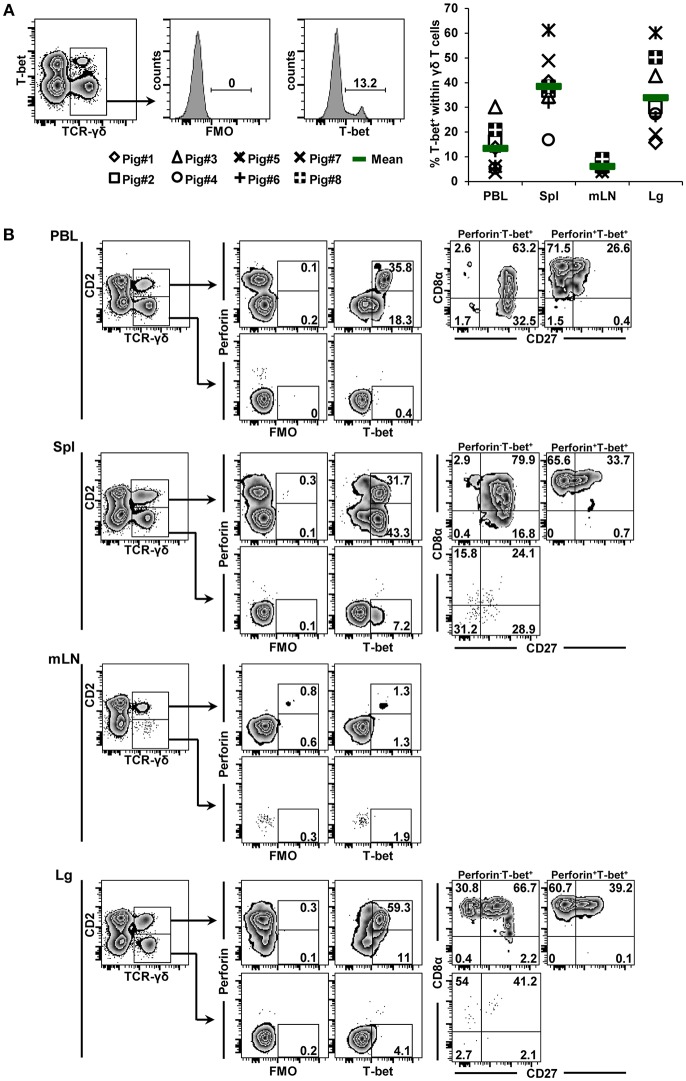
Frequency and phenotype of T-bet+ γδ T cells in different organs. (A) Following exclusion of dead cells (not shown), TCR-γδ+ T cells were gated within live lymphocytes (zebra plot) and further subgated to analyze the expression of T-bet. The scatter diagram shows the frequency of T-bet+ γδ T cells isolated from blood (peripheral blood lymphocytes, PBL), spleen (Spl), mediastinal lymph node (mLN), and lung tissue (Lg). Each symbol represents data from one individual animal (n = 8). Green bars indicate mean values. (B) γδ T cells were gated for CD2+ and CD2− subsets and further analyzed for co-expression of perforin and T-bet. Perforin+ and perforin− T-bet+ γδ T cells were then gated and investigated for expression of CD27 and CD8α. Exemplary data of the four investigated locations, blood (peripheral blood lymphocytes, PBL), spleen (Spl), mediastinal lymph node (mLN) and lung tissue (Lg) from one animal are shown. Numbers located in gates and quadrants indicate percentage of cells for one particular phenotype. For T-bet/perforin-defined subpopulations below 10%, CD8α/CD27 expression is shown in dot plots, for T-bet/perforin-defined subpopulations below 2%, CD8α/CD27 expression is not shown.

