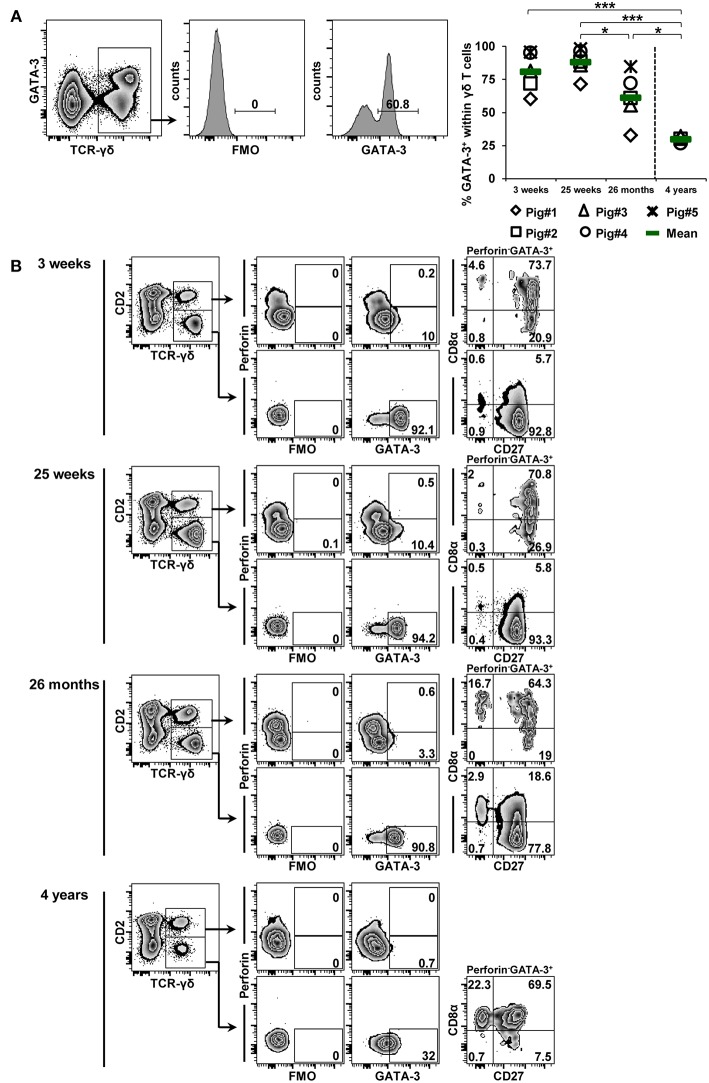
Figure 8.
Influence of aging on the expression of GATA-3 in blood-derived γδ T cells. (A) Following exclusion of dead cells (not shown), TCR-γδ+ T cells were gated within live lymphocytes (zebra plot) and further subgated to analyze the expression of GATA-3. The scatter diagram shows the frequency of GATA-3+ γδ T cells within live peripheral blood lymphocytes (PBL) isolated from pigs at 3 weeks, 25 weeks, 26 months, and 4 years of age. Each symbol represents data from one individual animal (for 3 weeks, 25 weeks, and 26 months of age animals (n = 5) were bled repeatedly; for 4 years of age, blood was obtained from different animals (n = 4); change in animals is indicated by a dashed line). Green bars indicate mean values. Data were subjected to one-way ANOVA analysis with Bonferroni correction as post-hoc test for pairwise comparison after positive testing for normal distribution (Shapiro-Wilk test). (B) γδ T cells were gated for CD2+ and CD2− subsets and further analyzed for co-expression of perforin and GATA-3. Perforin+ and perforin− GATA-3+ γδ T cells were then gated and investigated for expression of CD27 and CD8α. Representative data for the four investigated stages of life are shown. Numbers located in gates and quadrants indicate percentage of cells for one particular phenotype. For GATA-3/perforin-defined subpopulations below 10%, CD8α/CD27 expression is shown in dot-plots, for GATA-3/perforin-defined subpopulations below 2%, CD8α/CD27 expression is not shown.

