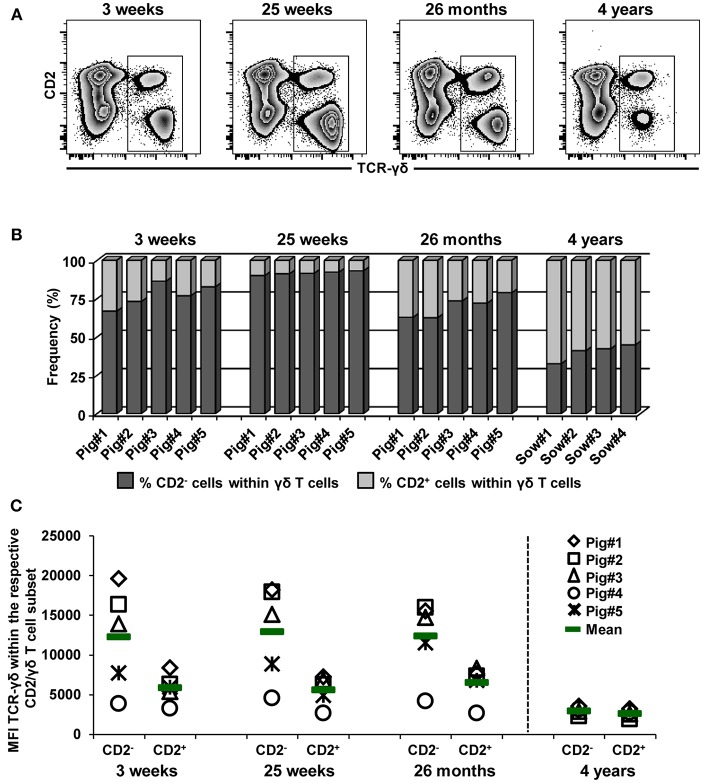
Figure 9.
Influence of aging on the frequency of CD2− and CD2+ γδ T cells in blood. (A) Live lymphocytes isolated from pigs at 3 weeks, 25 weeks, 26 months, and 4 years of age were analyzed for the expression of TCR-γδ vs. CD2 (zebra plots). Representative data from one animal per time point are shown. Total γδ T cells were gated and further subgated into CD2− and CD2+ γδ T cells (not shown). (B) Stacked bar graphs indicate the frequency of CD2− cells (dark gray bar) and CD2+ cells (light gray bar) within total γδ T cells. Data of the same five pigs are shown from 3 weeks to 26 months of age (these animals were bled repeatedly), whereas for 4 years of age, data from four different animals are presented. (C) Median fluorescence intensity (MFI) of TCR-γδ expression in CD2− and CD2+ γδ T cells at different stages of life. Each symbol represents data from one individual animal (for 3 weeks, 25 weeks, and 26 months of age animals (n = 5) were bled repeatedly; for 4 years of age, blood was obtained from different animals (n = 4); change in animals is indicated by a dashed line). Green bars indicate mean values.

