Fig. 1.
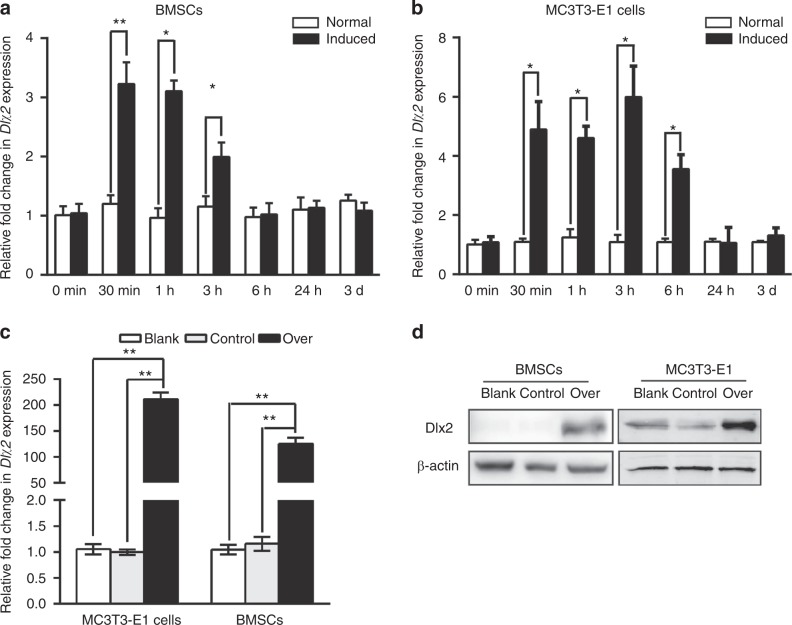
Analysis of Dlx2 expression by RT-qPCR in BMSCs and MC3T3-E1 cells upon osteogenic induction. Endogenous expression of Dlx2 in BMSCs (a) and MC3T3-E1 cells (b) at different time points upon osteogenic induction. Relative transcript levels of Dlx2 at each time point were quantified by RT-qPCR and normalized with a house-keeping gene Gapdh. Student’s t tests were used to determine statistical significance; n = 3. Error bars represent SDs. *P < 0.05; **P < 0.01. c Dlx2 expression in BMSCs and MC3T3-E1 cells was evaluated with RT-qPCR. Gene expression was normalized with Gapdh, and statistical significance was determined as described in a. d Protein levels of Dlx2 in BMSCs and MC3T3-E1 cells were measured by Western blot analysis. Blank, BMSCs/MC3T3-E1 cells; control, Lenti-CTRL transduced BMSCs/MC3T3-E1 cells; over, Lenti-DLX2 OE transduced BMSCs/MC3T3-E1 cells. β-Actin was used as an internal control

