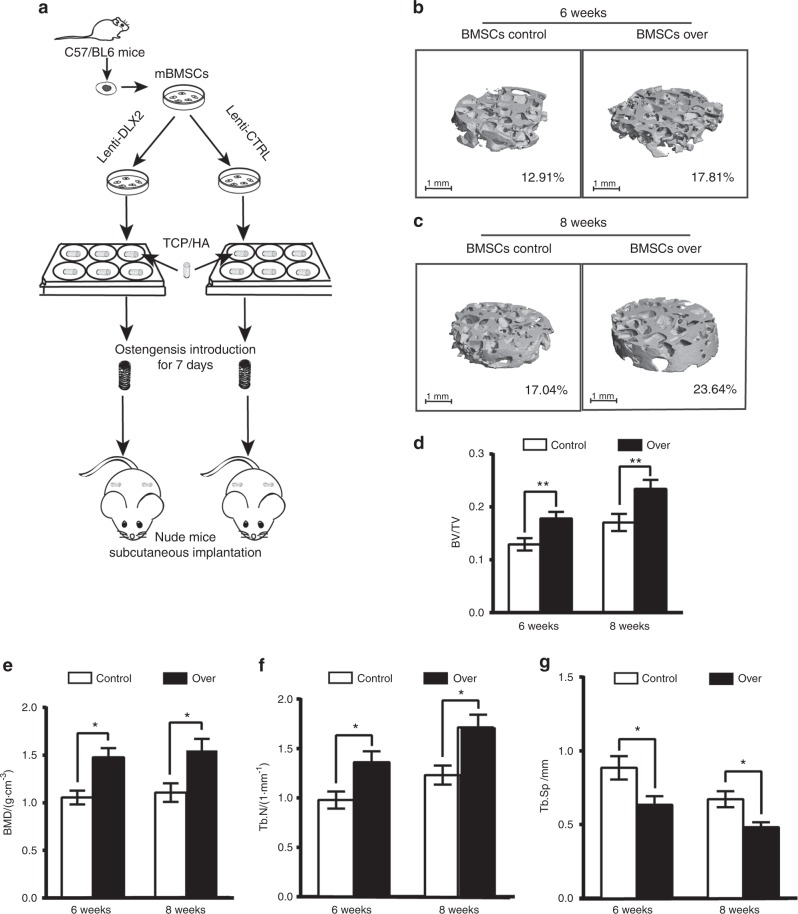
Fig. 3.
Dlx2-overexpressing BMSCs accelerated bone formation in vivo. a Schematic diagram of implantation experiments. The whole BMSCs/β-TCP constructs were obtained for micro-CT analysis 6 or 8 weeks after implantation. b, c Representative 3D reconstructed micro-CT results of the BMSCs/β-TCP constructs at weeks 6 and 8 after subcutaneous implantation. Implants were then harvested after 6 (b) or 8 (c) weeks, and were scanned by micro-CT. Scale bar = 1 μm. Average BV/TV is indicated below. Over, BMSCs transduced with Lenti-DLX2 OE; control, BMSCs transduced with Lenti-CTRL. d–g Analysis of the bone volume/tissue volume (BV/TV), bone mineral density (BMD), trabecular number (Tb.N), and trabecular spacing (Tb.Sp) in the respective groups. Statistical significance was determined as described in Fig. 1; n = 6, *P < 0.05, **P < 0.01

