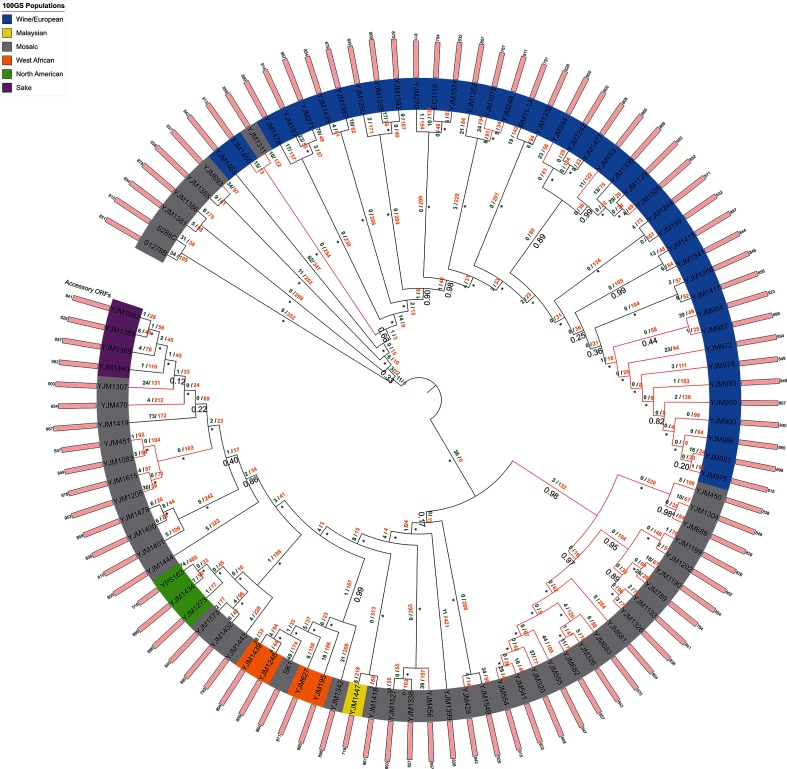
Fig. 2.
Approximate maximum-likelihood supermatrix phylogeny of the Saccharomyces cerevisiae pan-genome dataset based on 4311 core orthologue clusters. Saccharomyces cerevisiae populations are as assigned by Strope et al., clinical strains are indicated by red branches. Numbers below branches refer to Shimodaira–Hasegawa local supports, maximum supports are indicated by asterisks. Dollo parsimony analysis of gene model gain/loss events is annotated above branches in green and orange, respectively.

