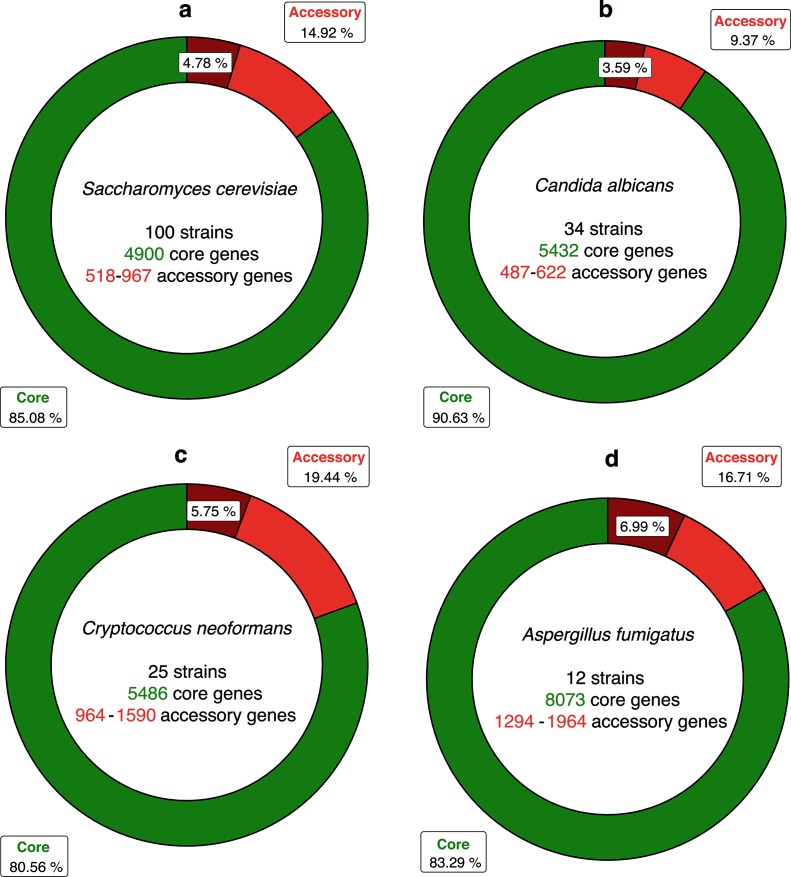
Fig. 6.
Pan-genomes of four fungal species. (a) Saccharomyces cerevisiae, (b) Candida albicans, (c) Cryptococcus neoformans var. grubii, (d) Aspergillus fumigatus. The ring charts represent the total number of gene models in pan-genome complements expressed as a proportion of total pan-genome size. Sections in dark-red represent duplicated core gene models in the accessory genome.

