Fig. 4.

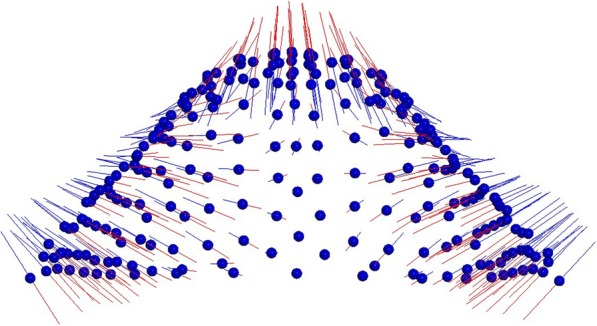
Results of PC1 from a posterior view. Blue dots represent the average of the palatal shape; blue lines show the trend of MG1; red lines show the trend of MG2

Results of PC1 from a posterior view. Blue dots represent the average of the palatal shape; blue lines show the trend of MG1; red lines show the trend of MG2