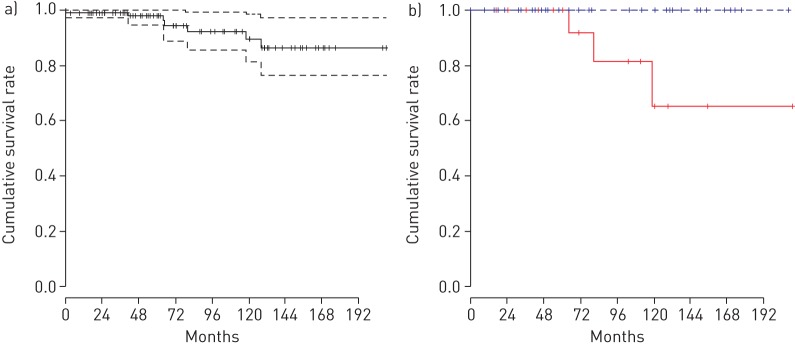
FIGURE 5.
Kaplan–Meier survival curves showing survival rates over time (short perpendicular lines indicate the censored data). a) Kaplan–Meier survival curve showing the cumulative survival rate for the 103 cases from group C diagnosed at Tohoku (n=38), Niigata (n=47) and Kyorin (n=18) University Hospitals from 1999 to 2017 (the dotted lines indicate the 95% confidence interval). b) Kaplan–Meier survival curves comparing the cumulative survival rates between two groups separated according to median % predicted diffusing capacity of the lung for carbon monoxide (DLCO) at diagnosis (the blue line indicates a % predicted DLCO at diagnosis that was >75.8% while the red line indicates a % predicted DLCO at diagnosis that was <75.8%).

