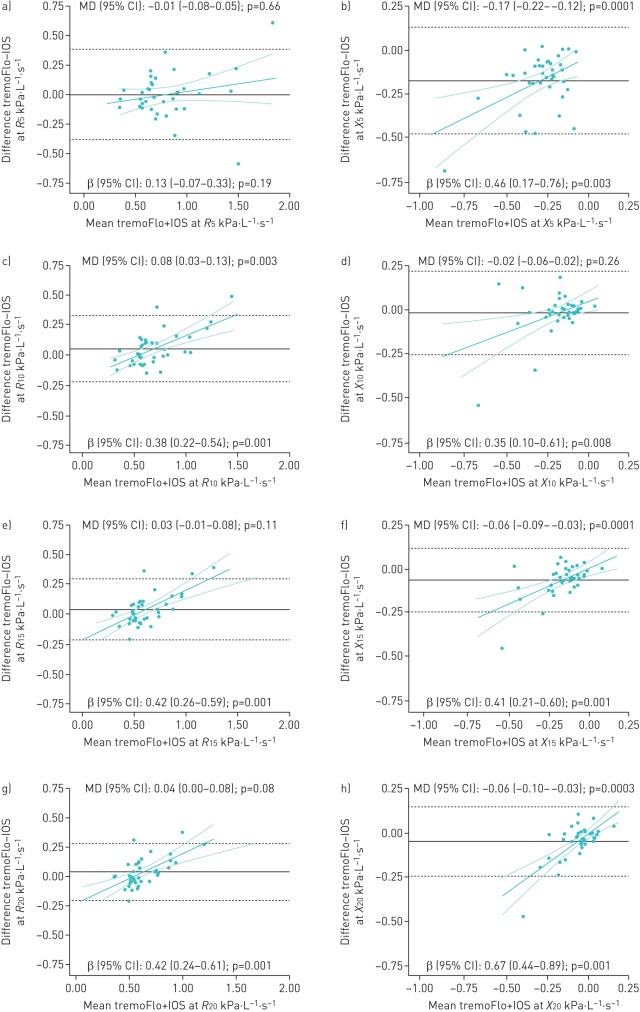
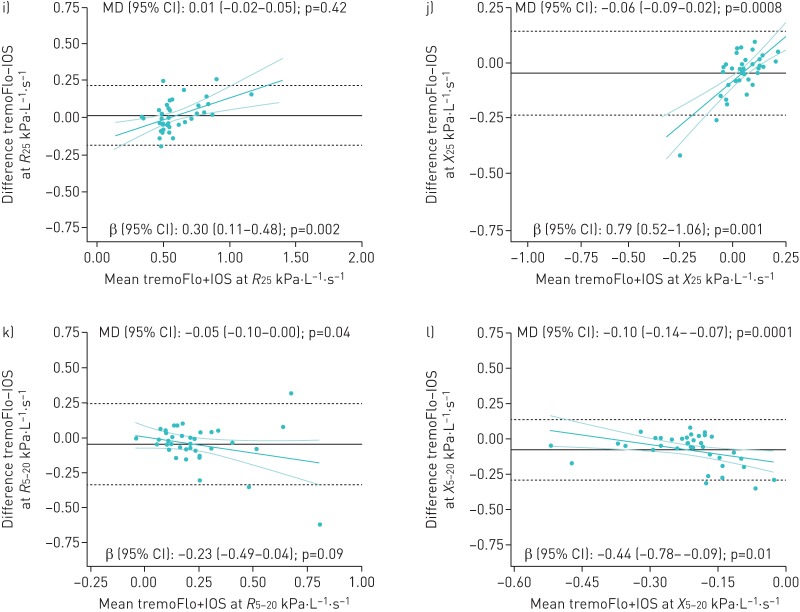
FIGURE 2.
a–l) Bland–Altman plots of absolute differences between tremoFlo and MasterScreen impulse oscillometry system (IOS) measurements versus the mean of the two measurements in resistance R (left panels) at a) 5, c) 10, e) 15, g) 20, i) 25 and k) 5–20 Hz and in reactance X (right panels) at b) 5, d) 10, f) 15, h) 20, j) 25 and l) 5–20 Hz in 38 patients with reproducible IOS measurements. MD: mean difference. In each plot, the black solid horizontal line represents the absolute within-patient MD between parameters measured on the tremoFlo minus those on the IOS, with 95% of all absolute differences contained within the black dashed horizontal lines. These values are indicated as MD (95% CI) in kPa·L−1·s−1 at the top of each plot: values >0 indicate that tremoFlo measurements were higher than IOS measurements and vice versa. The magnitude and direction of the proportional bias is depicted by the green linear regression line with the 95% confidence interval and is indicated as β (95% CI) at the bottom of each plot.


