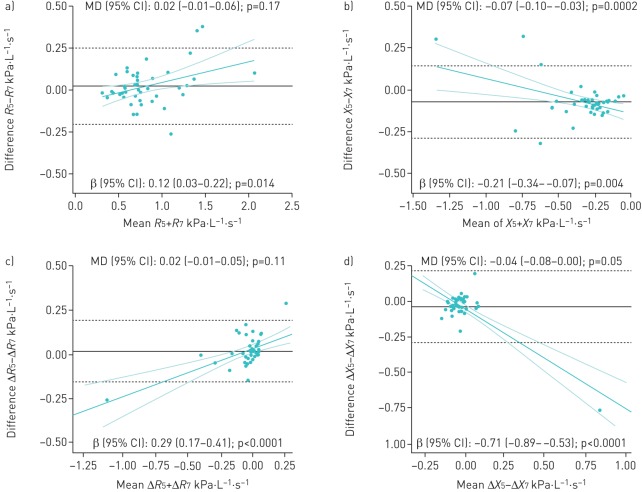
FIGURE 3.
a–d) Bland–Altman plots of absolute differences between tremoFlo at 5 and 7 Hz versus the mean of the two measurements in resistance R and reactance X in 44 patients with reproducible measurements for a) R and b) X and in 42 patients for c) ΔR and d) ΔX. MD: mean difference. In each plot, the black solid horizontal line represents the absolute MD, with 95% of all absolute differences contained within the black dashed horizontal lines. These values are indicated as MD (95% CI) in kPa·L−1·s−1 at the top of each plot: values >0 indicate that tremoFlo measurements at 5 Hz are higher than at 7 Hz and vice versa. The magnitude and direction of the proportional bias is depicted by the green linear regression line with the 95% confidence interval and is indicated as β (95% CI) at the bottom of each plot.

