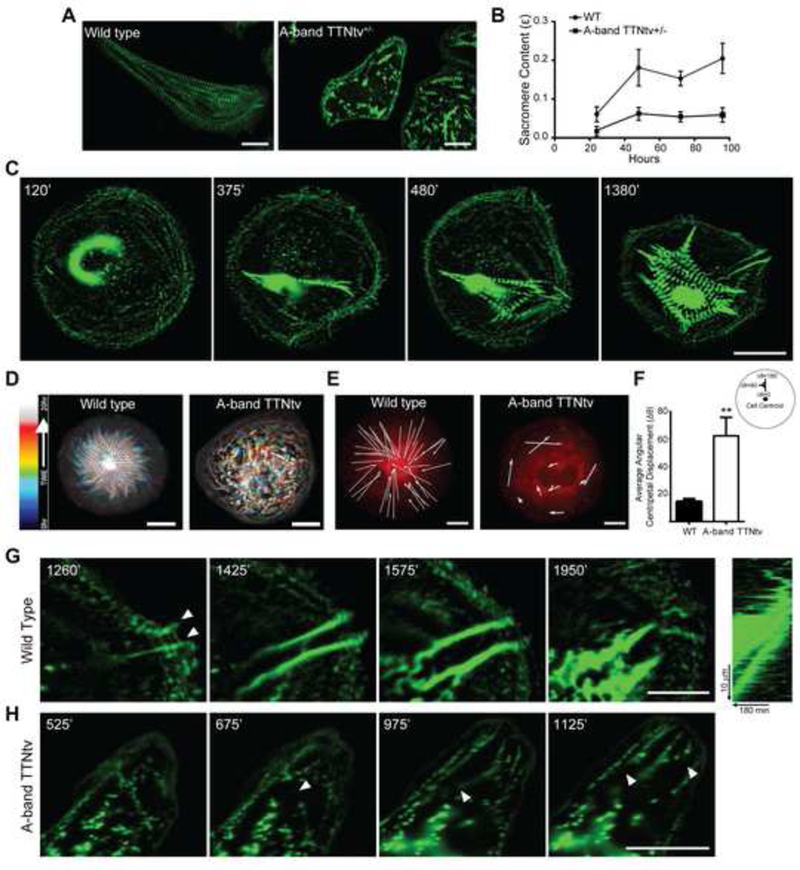
Figure 1: TTNtvs lead to sarcomere insufficiency due to impaired sarcomerogenesis.

(A) Immunostaining for Z-disc protein α-actinin-2 (green) shows decreased striation in heterozygous A-band TTNtv mutant cells compared to wild type, representative images of cells fixed and stained for actinin after 96 hours of culture, scale bars 20 μm. (B) Quantification of average sarcomere content in A-band TTNTv+/− and wild type cells over time; n≥8 WT cells, n≥9 A-band TTNtv+/− cells for each time point; across three independent experiments; mean ± s.e.m. (C) Time lapse images of GFP-actinin stably expressed in wild type cells shows de-novo sarcomerogenesis. Left to right, initial appearance of centripetal actinin fibers at the cell periphery leads to formation of sarcomeres and progresses with expansion of striation throughout the cell, scale bar 20 μm. (D) Temporal-color coded hyperstack of representative sarcomere assembly time lapse images showing the emergence of patterned myofibrils in wild type cells and an absence in A-band TTNtv cells. Scale bars 20 μm. (E) Representative displacement vectors of actinin puncta over time in wild type and A-band TTNtv cells. Scale bars 10 μm. (F) Quantification of angular centripetal displacement of actinin puncta towards the cell centroid in wild type and TTNtv cells. n=2256 tracked actinin particles across five WT and n=1683 actinin particles across five TTNtv cells; across three independent experiments; mean ± s.e.m.; t-test, **P<0.01. (G) Representative time lapse images of actinin puncta in wild type cells forming centripetal actinin fibers. Arrows indicate the emanation of actinin puncta from cell adhesion sites. Scale bar 20 μm. (H) Representative time lapse images of actinin puncta in TTNtv cells, arrows indicate the rupturing events of existing actinin fibers at the cell edge. Scale bar 20 μm. See also Figure S1.
