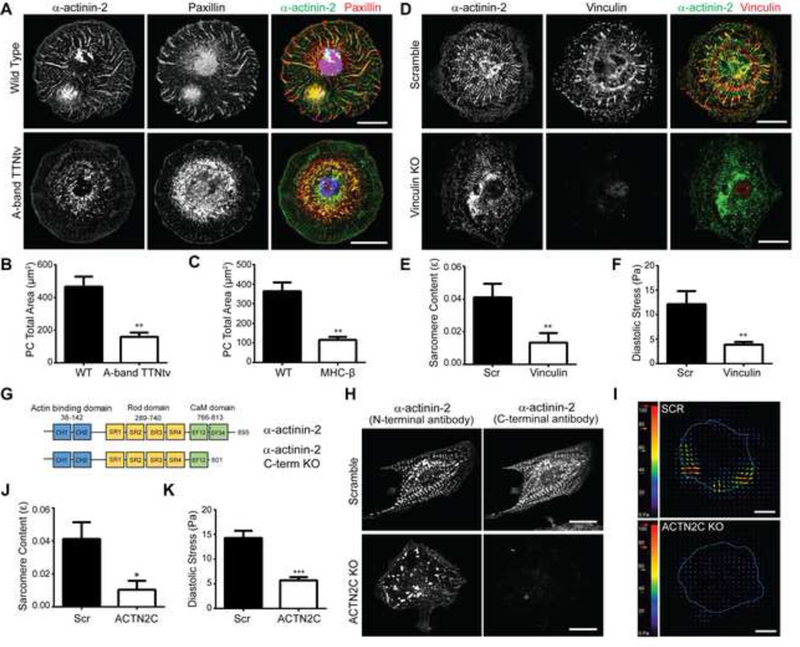
Figure 4: Titin is a critical mechanical link between protocostameres and myosin generated forces to drive the sarcomere assembly.

(A) Top and bottom panel (left to right) representative images of the basal surface of cells during nascent centripetal fiber formation stained for actinin (green) and paxillin (red) in wild type and A-band TTNtv cells, merge shows nuclear stain with DAPI in blue. Scale bars 20 μm. (B) Quantitative bar graph comparisons of average total protocostamere (PC) area present in WT vs A-band TTNtv cells and (C) WT vs MHC-P KO cells. n=21 wild type cells, n=16 A-band TTNtv cells and n=34 wild type cells, n=34 cells MHC-β KO cells; across three independent experiments; mean ± s.e.m.; t-tests, **P<0.01. (D) Top and bottom panel (left to right) representative images of cells stained for actinin (green) and vinculin (red) in scramble control and vinculin KO cells. Scale bars 20 μm. (E) Quantitative bar graph comparing the sarcomere content in scramble and vinculin KO cells. n=11 scramble cells, n=8 vinculin KO cells; across three independent experiments; mean ± s.e.m.; t-test, **P<0.01.(F) Average root mean square (RMS) diastolic traction stress (Pa) in scramble and vinculin KO cells. n=12 scramble cells, n=13 vinculin KO cells; across three independent experiments; mean ± s.e.m.; t-test, **P<0.01. (G) Diagram showing the CRISPR- mediated c-terminal actinin truncation of the titin binding domain. (H) Top and bottom panel (left to right) representative images of cells stained for N-terminal actinin (green) and C-terminal actinin (red) in scramble and actinin c-terminal knock out cells. Scale bars 20 μm. (I) Representative stress maps of scramble and ACTN2-C KO cells. Scale bars 20 μm. (J) Quantification of sarcomere content comparing wild type and ACTN2-C KO cells. n=10 scramble cells, n=16 ACTN2-C KO cells; across three independent experiments; mean ± s.e.m.; t-test, *P<0.05. (k) Average root mean square (RMS) diastolic traction stress (Pa) in scramble and ACTN2-C KO cells. n=15 Scr cells and n=12 ACTN2-C KO cells; across three independent experiments; mean ± s.e.m.; t-test, ***P<0.0005. See also Figure S3.
