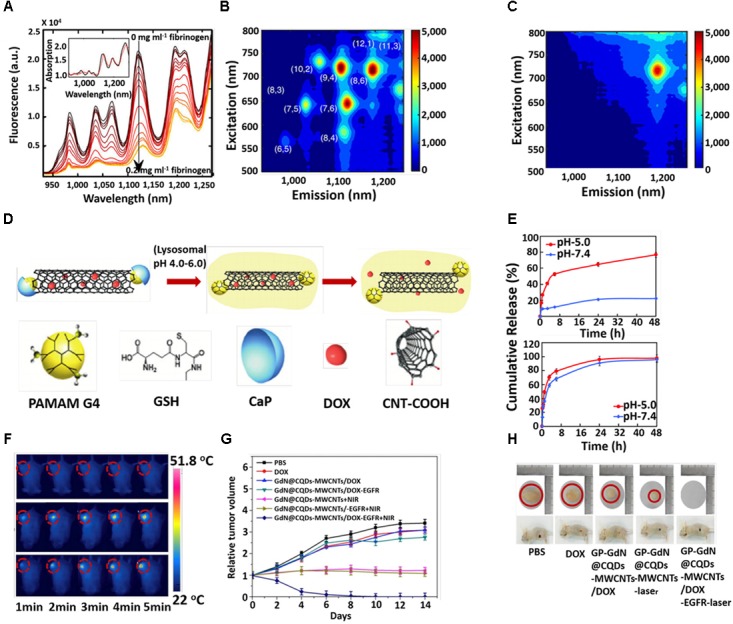
FIGURE 2.

(A) Fluorescence spectra of 1,2-bis(diphenylphosphino) ethane (DPPE)-polyethylene glycol (PEG)-SWCNT with different concentrations of fibrinogen. Excitation-emission of DPPE-PEG-SWCNT solution (B) before and after (C) fibrinogen adding. (D) Schematic illustration for the triggered release of DOX from DOX-loaded CaP nanocapsule under intracellular endo/lysosomal conditions. (E) DOX release profile at pH 7.4 and 5 with time from CNT–G4–GSH–CaP–DOX and (upper) CNT–G4–GSH–DOX (lower). (F) In vivo photothermal images under 5 min NIR laser (808 nm, 1 W/cm2) irradiation. (G) Tumor growth curves after different treatments at different times. (H) Digital photographs of tumors and tumor-bearing mice after different treatments. Copyright Bisker et al. (2016) Nature publishing group, Banerjee et al. (2015) Royal Society of Chemistry, and Zhang et al. (2017) Elsevier.
