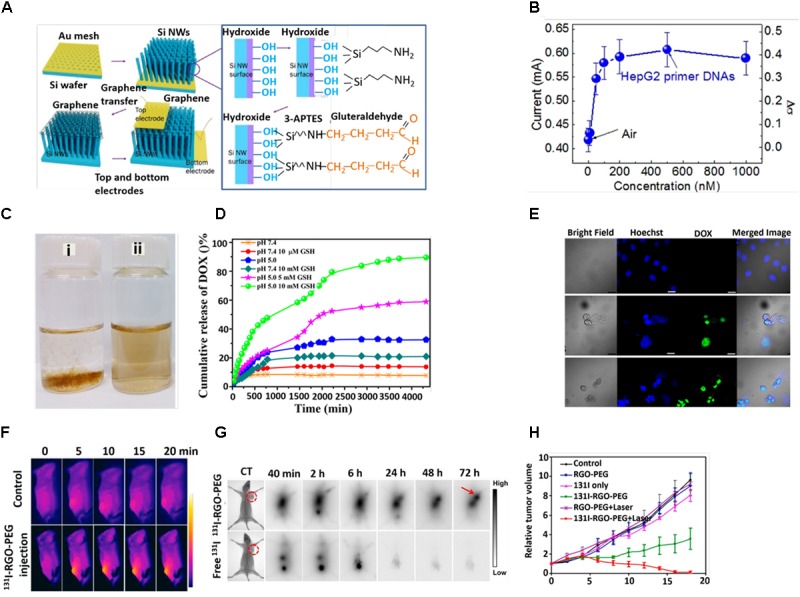
FIGURE 3.

(A) Schematic diagram of fabrication process. (B) Responsivity of graphene/Si-NWs biosensors: Current of a graphene/Si-NWs biosensor as a function of mole fraction of p-ss oligonucleotide. (C) Digital photographs of aqueous dispersion of (i) GON and (ii) GON-Cy-ALG-PEG in PBS. (D) DOX release profile at pH 7.4 and 5 in presence and absence of GSH. (E) Cellular uptake of HepG2 cells stained by Hoechst (blue), DOX (green)-loaded GON-Cy-ALG-PEG in presence and absence of GSH. Bars represent 30 μm. (F) In vivo photothermal therapy (G) in vivo gamma imaging study. (H) Tumor volume of mice after treatment. Copyright Kim et al. (2016) Nature publishing group, Zhao et al. (2015) American Chemical Society, and Chen et al. (2015) Elsevier.
