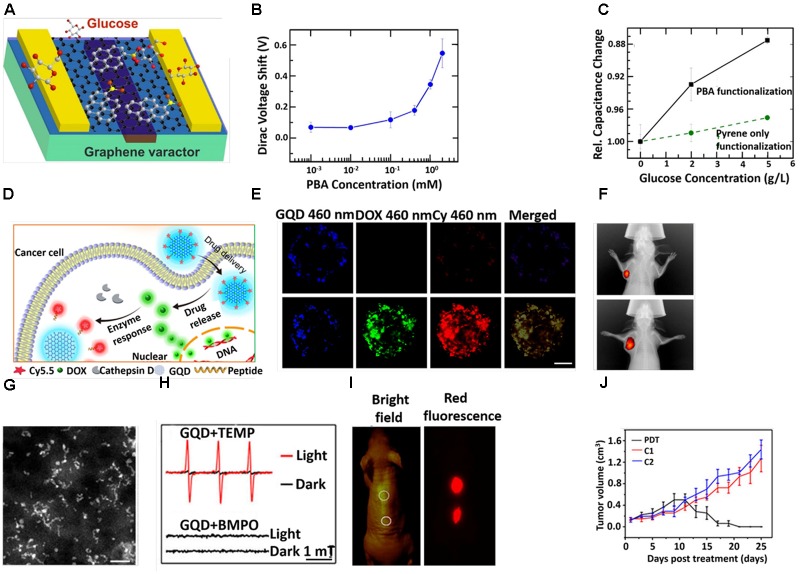
FIGURE 4.
(A) Schematic diagram of GQD-based varactor for glucose sensing. (B) Dirac voltage shift of graphene varactors with different concentrations of PBA solutions. (C) Curves for change in relative capacitance with glucose concentrations. (D) Schematic diagram for the drug delivery and release of GQD-based theranostic agent. (E) CLSM images of the multicellular tumor spheroids incubation with GQD-P-Cy and DOX@GQD-P-Cy. Scale bar: 100 μm. (F) In vivo fluorescence images of 4T1 tumor bearing mice after intravenous treatment with DOX@GQD-P-Cy. (G) STEM images. Scale bar, 20 nm. (H) The electron spin resonance (ESR) signals of 1O2 (up) and reactive oxygen species (ROS) (down) generated upon irradiation of GQDs for 8 min in the presence of 2,2,6,6-tetramethylpiperidine and 5-tert-butoxycarbonyl-5-methyl-1-pyrroline N-oxide, respectively. (I) In vivo fluorescence images of GQDs. (J) Time dependent tumor growth curves after different treatments. Copyright Ding et al. (2017) and Zhang D.Y. et al. (2017); American Chemical Society and Ge et al. (2014) Nature publishing group.

