Fig. 3.
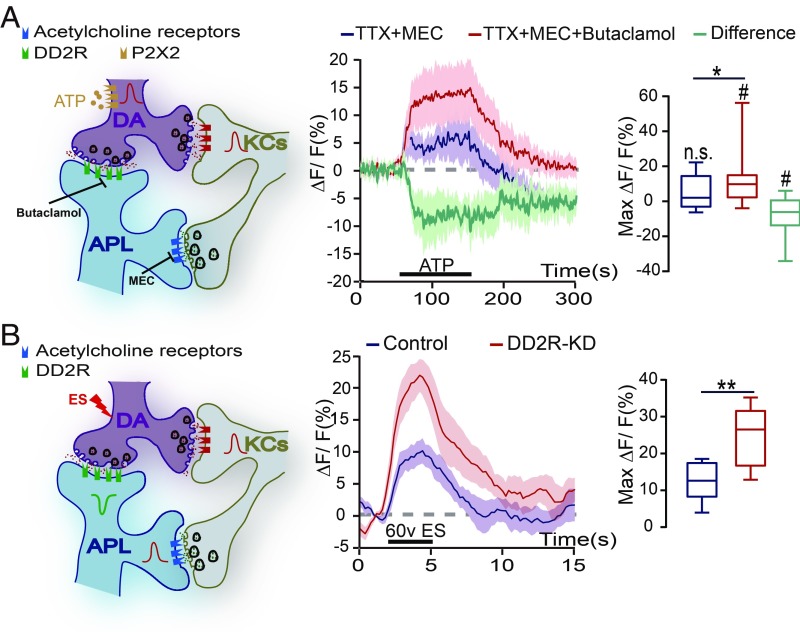
D2-like receptor mediates a suppressive DA signal in the DA-to-APL synapses. (A) Diagram of the KC-DA-APL circuitry, with P2X2 expressed in the DA neurons. On ATP perfusion, the APL neurons displayed no significant change in the calcium signal (n = 13), while this signal significantly increased after the incubation of DD2R antagonist butaclamol (n = 13). Images were recorded at the transverse plane of MB vertical lobe region. Data were quantified by the Wilcoxon signed-rank test and are presented in the boxplot graphs. The green line indicates the difference in the response to ATP activation. The genotype was GH146-Gal4,TH-LexA/UAS-GCaMP6m;UAS-mCherry/LexAop-P2X2. Shown is the average calcium response during the response platform to ATP treatment. n.s. and # indicate the statistical differences in each group compared with 0 (one-sample t test). (B) On ES stimulation, the calcium signal in APL neurons increased in control flies, and this elevation was significantly higher in DD2R-KD flies. The genotypes were GH146-Gal4,UAS-GCaMP6m/+ in the control group (n = 7) and GH146-Gal4,UAS-GCaMP6m/UAS-DD2R-RNAi in the DD2R-KD group (n = 8). The calcium response of the APL neurons was recorded in the transverse plane of the MB vertical lobe region. The peak response was quantified by the independent-samples t test and presented in the boxplot graphs. n.s. indicates no significant difference. #P < 0.05; *P < 0.05; **P < 0.01.

