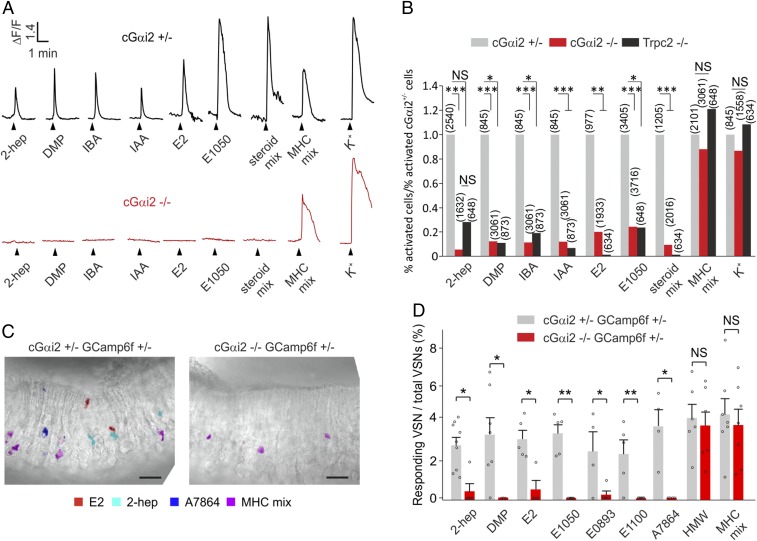
Fig. 2.
Essential role of Gαi2 in molecular sensing by apical VSNs. (A) Representative Ca2+ responses imaged in dissociated VSNs from cGαi2+/− and cGαi2−/− mice. Cells were stimulated with the following stimuli known to activate V1R/Gαi2- or V2R/Gαo-expressing VSNs: 2-heptanone (2-hep, 10−8 M); dimethylpyrazine (DMP, 10−6 M); isobutylamine (IBA, 10−7 M); isoamylamine (IAA, 10−7 M); β-estradiol (E2, 1 µM); 1,3,5(10)-estratrien-3,17β-diol disulfate (E1050, 1 µM); sulfated steroid mix E1050, E1100 [1,3,5(10)-estratrien-3,17β-diol 3-sulfate], E0893 [1,3,5(10)-estratrien-3,17α-diol 3-sulfate], and A7864 (5-androsten-3β,17β-diol disulfate), 1 µM each; MHC peptide mix (MHC mix; SYFPEITHI, SYIPSAEKI, AAPDNRETF, SIINFEKL, 10−10 M each), and high (50 mM) KCl solution (K+) as viability control. Note that cells from Gαi2−/− mice did not produce Ca2+ responses to the V1R ligands but did produce responses to the Gαo-dependent MHC peptide mix and high K+. (B) Analysis of ligand-evoked Ca2+ responses in dissociated cells from cGαi2+/−, cGαi2−/−, and Trpc2−/− mice. Data are expressed as the percentage of responding cells to a given stimulus divided by the percentage of responding cells in the cGαi2+/− controls [*P < 0.05, **P < 0.01, ***P < 0.001; nonsignificant (NS), P = 0.07–0.63, Fisher’s exact test]. Number of cells analyzed is indicated above each bar. Each stimulus was tested in 3–16 mice. (C) Spatial activation patterns obtained through GCaMP6f imaging in cGαi2+/− and cGαi2−/− VNO slices. Slices were stimulated with the steroids E2 (1 µM; red) and A7864 (1 µM; blue), 2-hep (10−8 M; cyan), and MHC mix (SYFPEITHI, SYIPSAEKI, AAPDNRETF, SIINFEKL, 10−10 M each; magenta). Stimulus-induced ΔF peak images were digitally superimposed onto the transmitted light image of the same slice (Methods; original ΔF peak images are shown in SI Appendix, Fig. S2). VSNs in cGαi2−/− slices responded to the MHC peptide mix but not to agonists of apical VSNs. (Scale bar, 25 µm.) (D) Percentage of responding VSNs/total VSNs in Gαi2−/− slices is strongly diminished or reduced to zero with stimuli known to activate apical VSNs (χ2 = 40.8, P < 0.001, Kruskal–Wallis ANOVA; *P < 0.05, **P < 0.01, Mann–Whitney U test; n = 2–3 slices per mouse from 7 cGαi2+/− and 5 cGαi2−/− GCaMP6f mice). No significant difference in the detection of Gαo-dependent stimuli is observed between the two genotypes [HMW, t(10) = 0.36; NS, P = 0.72; MHC mix, t(12) = 0.44; NS, P = 0.66]. Dots indicate the percentage of responding/total VSNs in independent slice recordings. Stimuli were tested one to three times per slice. Each stimulus was tested in at least three mice. Data are expressed as means ± SEM.

