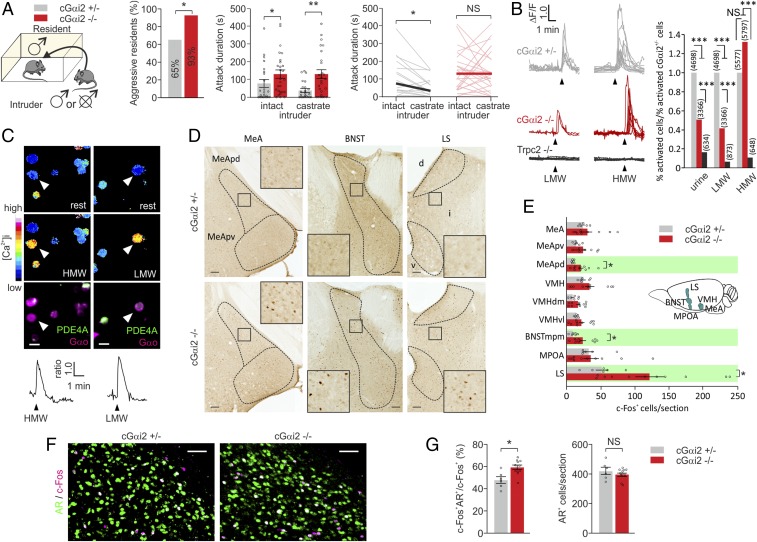
Fig. 3.
Loss of Gαi2 enhances territorial aggression and increases activity in aggression-controlling brain centers. (A) Territorial aggression is enhanced in sexually experienced cGαi2−/− resident males exposed to intact and castrated intruders in the resident–intruder assay. Fifteen of 23 cGαi2+/− mice (65%) and 25 of 27 (93%) cGαi2−/− resident males were aggressive at least once during three consecutive resident–intruder trials to intact and castrated male intruders (*P < 0.05, Fisher’s exact test). Cumulative attack duration was higher in cGαi2−/− residents (**P < 0.01 and *P < 0.05, Mann–Whitney U test). Comparison of cGαi2+/− residents’ behavior toward gonadally intact vs. castrated intruders indicates the normal reduction in aggression toward a castrate (*P < 0.05, Wilcoxon test). This behavior is lost in the cGαi2−/− residents [nonsignificant (NS), P = 0.8, Wilcoxon test]. (B) Examples of Ca2+ transients (Left) imaged in dissociated VSNs of cGαi2+/−, cGαi2−/−, and Trpc2−/− mice stimulated with LMW (1:100) and HMW (1:100) fractions. Analysis of responding cells over total cGαi2+/− responding cells (Right) reveals reduced responsivity to urine (1:100) and LMW fraction in cGαi2−/− cells and a loss in Trpc2−/− cells (***P < 0.001; NS, P = 0.2, Fisher’s exact test). Number of cells analyzed is indicated above each bar. Each stimulus was tested in 3–20 mice. (C) Fura-2 ratio imaging and post hoc IHC of cGαi2−/− cells indicate that cells activated by LMW and HMW fractions are Gαo+ and PDE4A−. Time points of Ca2+ images show resting or peak fluorescence levels to stimulation with HMW or LMW fractions. Representative Ca2+ transients shown for imaged cells (white arrowheads) are indicated for each condition. (Scale bar, 10 µm.) (D) Examples of c-Fos activation in MeA, BNST, and LS of cGαi2+/− and cGαi2−/− male mice exposed to intact male intruder for 10 min. Dashed lines indicate the border of brain areas. Boxes are shown at higher magnification in the Inset. (Scale bars, 100 µm.) (E) Quantification of c-Fos+ cells per section in cGαi2+/− (n = 6) and cGαi2−/− residents (n = 11) after exposure to an intact intruder reveals an increase in c-Fos expression in MeApd, BNSTmpm, and LS of cGαi2−/− mice (marked in green; *P < 0.05; NS, P = 0.15–0.99, Mann–Whitney U test). (F) Gαi2 deletion resulted in increased c-Fos activation of a population of GABAergic, AR+ neurons in the MeApd following a 10-min exposure to an intact male intruder. (G) Percentage of c-Fos+ neurons expressing AR (Left) and number of AR+ cells per section (Right) in the MeApd after a 10-min exposure to an intact male intruder (*P < 0.05; NS, P = 0.46, Mann–Whitney U test). (Scale bars, 50 µm.) d, dorsal LS; i, intermediate LS; v, ventral LS. Data are expressed as means ± SEM.

