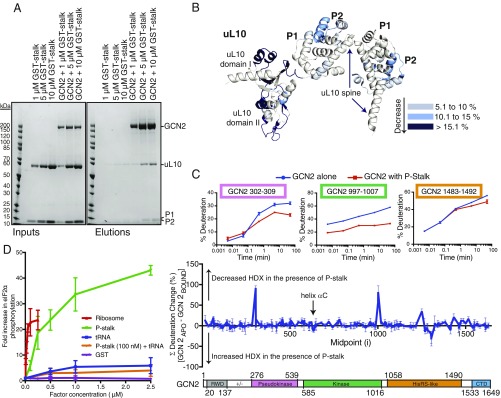
Fig. 4.
The isolated recombinant P-stalk binds GCN2. (A) Pulldowns showing that GCN2 can bind to the recombinant P-stalk. Increasing concentrations of the P-stalk were mixed with StrepTactin resin in the absence or presence of Strep-tagged GCN2, and the beads were then washed. Resultant complexes were eluted with sample buffer and analyzed by SDS/PAGE and Coomassie staining. The reaction inputs are shown on the Left, and the elutions are on the Right. (B) HDX-MS changes (summed over all time points) for the recombinant P-stalk in the presence of GCN2 are mapped on to the structure of the P-stalk (from 4V6X), colored according to the key on the Right. (C) HDX-MS changes for GCN2 in the presence of purified P-stalk. The percentage deuteration change was calculated by subtracting the percentage deuteration for each GCN2 peptide in the P-stalk–bound state from the same peptide in the apo state. The differences at each time point (0.3, 3, 30, 300, and 3,000 s) were summed for each peptide. The data shown in the Middle panel are the summed means of differences ± SDs (n = 3) plotted according to the peptide midpoint (i). A schematic of the GCN2 domain structure is given in the Lower panel. The Upper panel shows the time course for deuterium incorporation for three GCN2 peptides showing large differences in the rate of isotopic exchange in the presence of the P-stalk. (D) A comparison of stimulation of GCN2 by the P-stalk complex, ribosomes, and tRNA. Increasing concentrations of the various regulators were assayed for GCN2-mediated eIF2α phosphorylation. The reactions were analyzed by SDS/PAGE and Western blotting. Each titration included a control containing only GCN2 and eIF2α in the absence of any regulator, and the quantifications of the blots were normalized to this value. The data plotted are means ± SD for three independent experiments.

