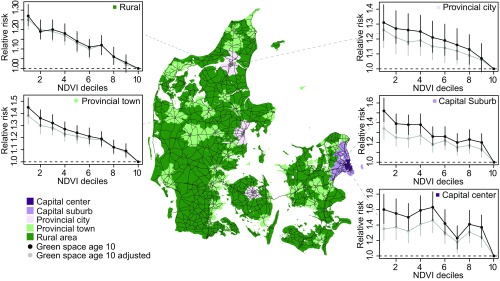
Fig. 2.
The association between relative risk of developing any psychiatric disorder and childhood green space presence across urbanization levels. Data were split between each of the five urbanization classes (Capital center n = 56 650, Capital suburb n = 124,193, Provincial city n = 90,648, Provincial town n = 265,570, and Rural n = 376,525). NDVI was recalculated as deciles, and separate models, shown in black, were fitted within each urbanization class to determine the shape of the association between green space and mental health. Integer values on the x axis refer to decile ranges, i.e., 1 corresponds to decile 0 to 10%. An additional model, shown in grey, was fitted for each urbanization class to adjust for urbanization and parents’ socioeconomic status. Estimates of relative risk from all five models were adjusted for year of birth and gender and plotted with 95% CIs within each degree of urbanization.

