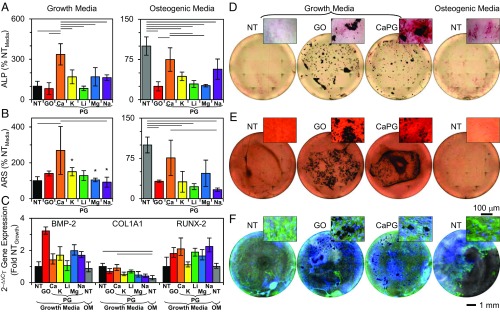
Fig. 4.
CaPG induces osteogenic differentiation of hMSCs. (A) ALP expression of hMSCs exposed to PG materials for 10 d for growth media and 21 d for osteogenic media. ANOVA F values: 13.48 for growth media and 12.83 for osteogenic media. (B) ARS of hMSCs exposed to PG materials for 28 d quantified from ARS absorbance. ANOVA F value: 3.66 for growth media and 8.44 for osteogenic media. *n < 3 due to off-center localization of the majority of hMSCs (SI Appendix, SI Text). (C) Gene expression after 14 d of exposure to PG materials quantified from qRT-PCR using the 2–ΔΔCt method compared with two reference genes. Note that the no treatment (NT) growth media sample is the calibrator. ANOVA F value: 1.88 for BMP-2, 3.30 for COL1A1, and 1.37 for RUNX-2. (D–F) Representative whole-well and higher-magnification images of (D) ALP expression (red); (E) ARS expression (red); and (F) nuclei (blue), F-actin (green), and phase contrast (gray). Bars are sample means, and error bars are sample SDs except for C, for which they are propagated SEs; n = 3 for all except for ALP growth media, for which n = 4. Lines between bars indicate a two-tailed P value < 0.05 from Sidak post hoc test.

