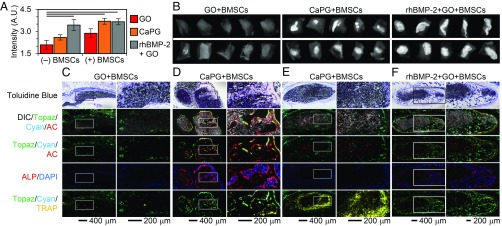
Fig. 5.
CaPG in the presence of BMSCs induces osteogenesis in vivo after 8 wk. (A) Quantification of X-ray image intensity demonstrates that CaPG significantly increases the formation of mineralized tissue compared with GO. When CaPG was combined with BMSCs, the corresponding X-ray image intensity was statistically similar (P value = 1) to that observed for s.c. injections of rhBMP-2. Note that bars are sample means and error bars are SEMs; n = 10. ANOVA F value: 6.94; lines between bars indicate a two-tailed P value < 0.05 from Sidak post hoc test. (B) Representative X-ray images of the harvested s.c. tissue. (C–F) Histology showing toluidine blue and overlay images of differential interference contrast (DIC) (grayscale), donor BMSCs (cyan), host cells (topaz), AC (red), ALP (red), DAPI (blue), and TRAP (yellow). Mineral accumulation is shown in white in DIC images. Host-derived and donor-derived osteoblasts are expressing bright topaz and cyan signals, respectively, that are colocalized with a sharp AC label and ALP staining. The AC label indicates active mineralization in the past 24 h, whereas ALP staining represents ALP-positive osteoblasts. Cell nuclei are stained blue with DAPI. TRAP-positive osteoclasts are identified by their bright yellow stain that is colocalized with faint topaz/cyan cells. Host-derived fibroblasts express faint topaz and are negative for AC, ALP, or TRAP. Undifferentiated donor cells are expressing faint cyan and are negative for AC, ALP, or TRAP.

