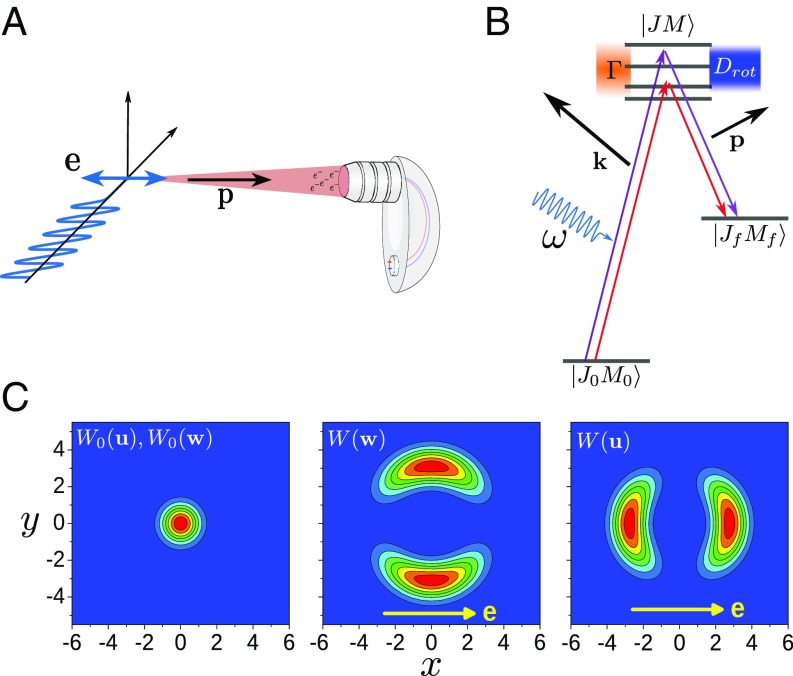
Fig. 3.
Experimental setup and physical picture of the molecular Auger process initiated by photoionization with high-energy X-ray photons. (A) Diagram of the experimental setup with the polarization direction of the synchrotron radiation and the momentum of the detected Auger electron . (B) Quantum picture of the Auger process accompanied by rotational excitations. The Auger process is strongly affected by the interference of the Auger channels going through different rotational levels of the core-ionized state (more details are in the text and SI Appendix). (C) Velocity distributions and angular velocity distributions . Left shows the thermal velocity distribution and the thermal angular velocity distribution with , , and for the translational degrees of freedom as well as , , and for the rotational degrees of freedom. Center and Right display the angular velocity distribution and the velocity distribution , respectively, caused by the emission of a high-energy photoelectron. The distributions and are planar cuts through the torus- and dumbbell-like 3D distributions, respectively, that include the axis along .

