Fig. 7.
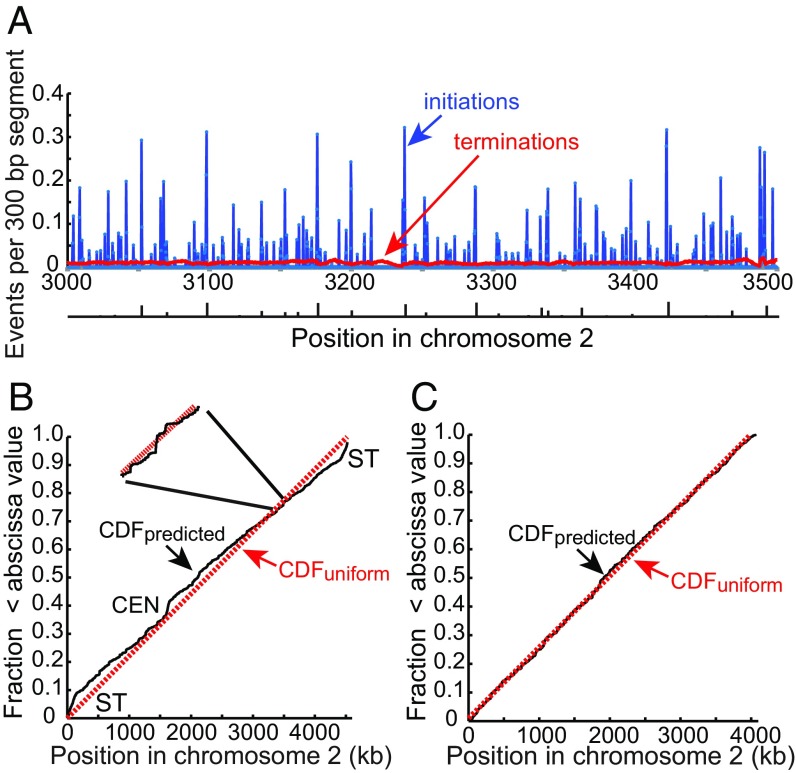
Initiations and terminations. (A) Average number of initiations and terminations per cell cycle for each 300-bp segment in the same 500-kb region of chromosome 2 as in Figs. 4 and 6. The frequency of initiations and terminations in each segment of the genome was determined by simulations with a total of about 2M initiation events. The origins identified from polymerase usage data by Daigaku et al. (26) are shown below the figure with the height of each bar indicating the relative efficiency of use. (B) Probability of pre-RCs in 300-bp bins across chromosome 2 plotted as a cumulative distribution function (CDF). The probabilities were calculated from the function given in the legend of Fig. 4. The red dotted line is the CDF of a uniform distribution. Inset shows the local fluctuation in the probability of pre-RC assembly in a short segment of the chromosome. ST, subtelomere; CEN, centromere. (C) CDF of pre-RC site probability after elimination of centromere and subtelomeric regions, amounting to about 8% of the genome.

