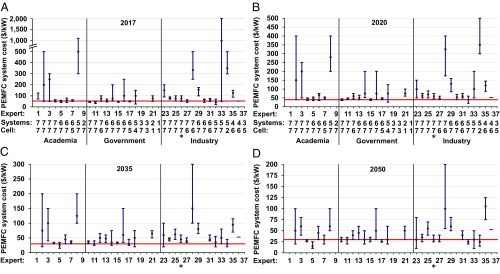
Fig. 3.
Experts’ assessments of PEMFC system cost (2017 USD). Each data point represents an expert’s best estimate, and the uncertainty ranges represent experts’ judgments of a 95% CI. Expert 36 provided only a lower bound across all years. The group interview is marked by an asterisk. (A) 2017 values. The horizontal line represents the DOE’s 2015 estimate of $53/kW. The vertical axis is broken between $500/kW and $1,000/kW. (B) 2020 values. The horizontal line represents the DOE’s 2020 target of $40/kW. (C) 2035 values. The horizontal line represents the DOE’s ultimate target of $30/kW. (D) 2050 values. The horizontal line represents the DOE’s ultimate target of $30/kW.

