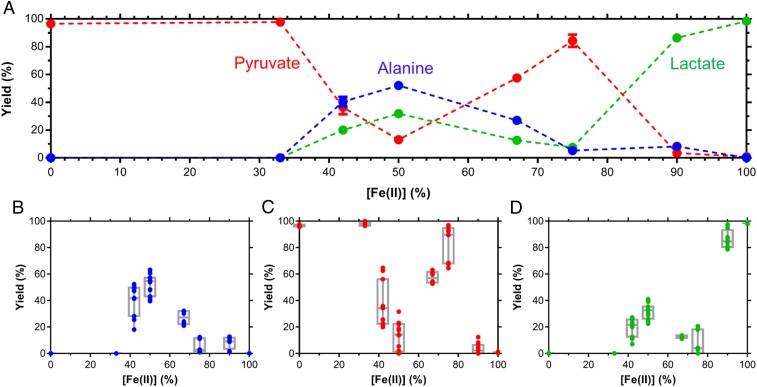
Fig. 4.
Pyruvate reactions after 48 h at pH 9.2 and 70 °C as a function of the Fe(II) vs. Fe(III) mole fraction of the iron hydroxide precipitate. (A) Means and SEM for alanine (blue), pyruvate (red), and lactate (green) over the range of Fe(II) mole fraction tested. (B–D) Plots of analyte reaction yields (B: alanine; C: pyruvate; D: lactate) with values from individual experiments superimposed; the box extends from the 25th to 75th percentiles, with the horizontal line in the box representing the median; whiskers represent the lowest and highest datum.

