Fig. 3.
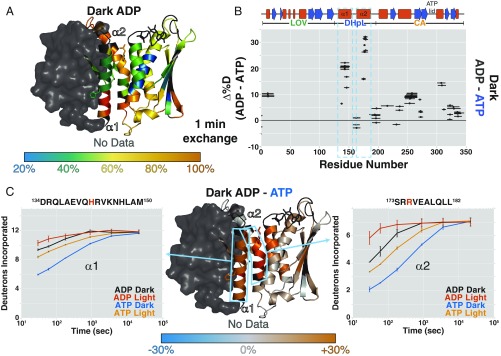
ADP decreases EL346 stability overall. (A) Percentage of deuteration at each amide site after 1 min of exchange in the dark with ADP mapped onto the EL346 structure. AMP-PNP is converted to ADP in PyMOL (51) for visualization. Residues with no data are dark gray. (B) Differences between the percentage of deuteration at each peptide after 1 min of exchange in the dark with ADP and ATP plotted against the EL346 primary sequence. Helices (red boxes) and strands (blue arrows) are shown above. (C) Difference between percentage of deuteration at each amide site after 1 min of exchange in the dark with ADP and ATP mapped onto the EL346 structure (Center). Residues with no data are dark gray. Sky blue boxes highlight representative peptides from DHpL helices α1 (Left) and α2 (Right) shown with uptake plots in the dark and light with ATP or ADP. ADP, dark (black); ADP, light (vermillion); ADP, dark (blue); and ATP, light (orange). Phosphoacceptor H142 and ATP-coordinating R175 are highlighted in vermillion in the peptide sequence.

