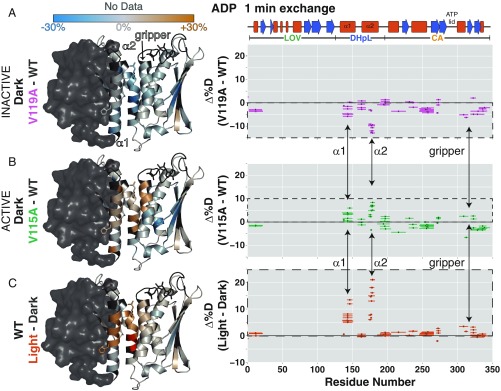
Fig. 4.
Comparison of inactive (V119A) and active (V115A) mutants also implicates DHpL helix exposure in activation. Difference between the extent of deuteration after 1 min of exchange between inactive V119A and WT EL346 (A) in the dark, active V115A and WT (B) in the dark, and in the light and dark for WT (C), with ADP, depicted as the difference between the percentage of deuteration at each amide site mapped onto the EL346 structure (Left) and the difference between the percentage of deuteration at each peptide plotted against the EL346 primary sequence (Right). Residues with no data are dark gray. Helices (red boxes) and strands (blue arrows) are shown above. Opposing changes in exchange localize to the DHpL helices and gripper helix and are shown with arrows.

