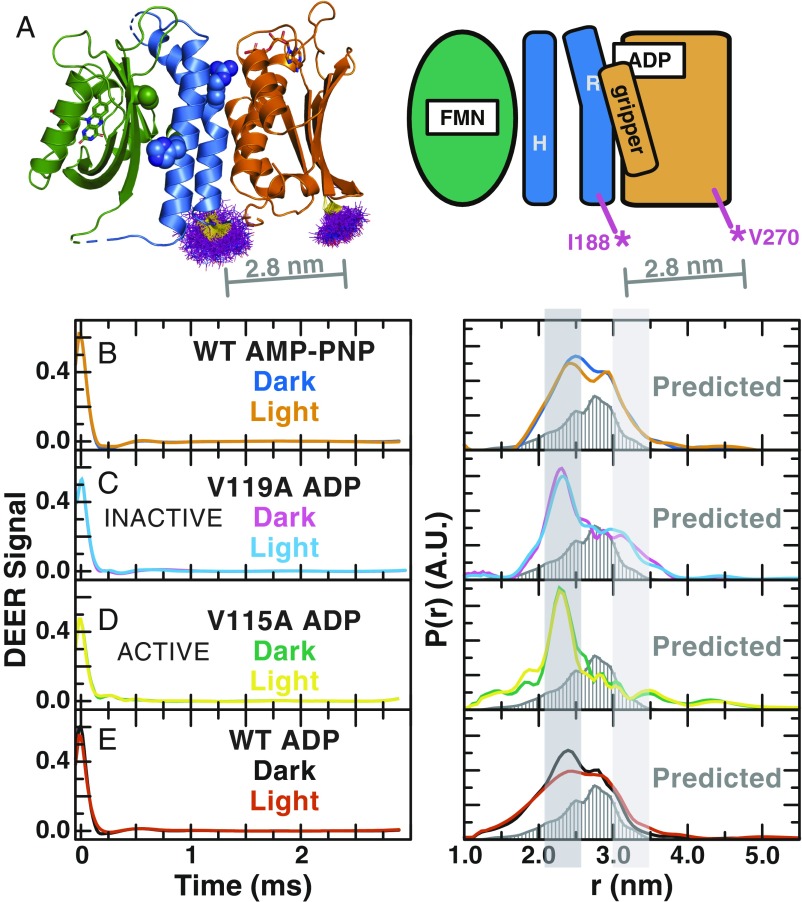
Fig. 6.
DEER distance reveals multiple conformations in dark and light states of EL346. (A) MTSL label rotamer distributions (purple lines) at positions 188 and 270 in the EL346 dark-state crystal structure (PDB ID code 4R3A) calculated by mtsslWizard (52) and schematic diagram of label sites I188C and V270C in EL346 showing LOV (green), DHpL (blue), and CA (orange) domains. The average predicted distance of 2.8 nm is shown as a gray line. (B–E) Baseline-subtracted wavelet-denoised time domain DEER signal (Left) and distance distributions of wavelet-denoised DEER data (Right) for EL346 WT with AMP-PNP (B) in the dark (blue) and light (orange), inactive V119A with ADP (C) in the dark (purple) and light (sky blue), active V115A with ADP (D) in the dark (green) and light (yellow), and WT with ADP (E) in the dark (black) and light (vermillion) labeled at positions 188 (DHpL) and 270 (CA). All Right panels also show the predicted distance distribution (dark gray, bars) generated by MMM software (35) from the crystal structure of dark-state EL346 as well as highlighted peaks assigned to different states at ∼2.3 nm (dark gray, broken) and >3.0 nm (light gray, inactive).

