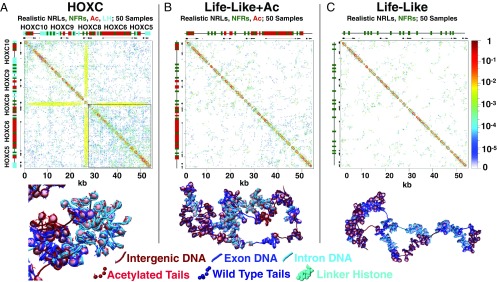
Fig. 2.
Fiber renderings and contact probability matrices for HOXC and reference fibers. Black bars (top and sides) show the positions of HOXC genes. (A) HOXC system. (B) Reference system with life-like nucleosome positions, NFRs, and acetylation marks. (C) Reference system with life-like nucleosome positions and NFRs.

