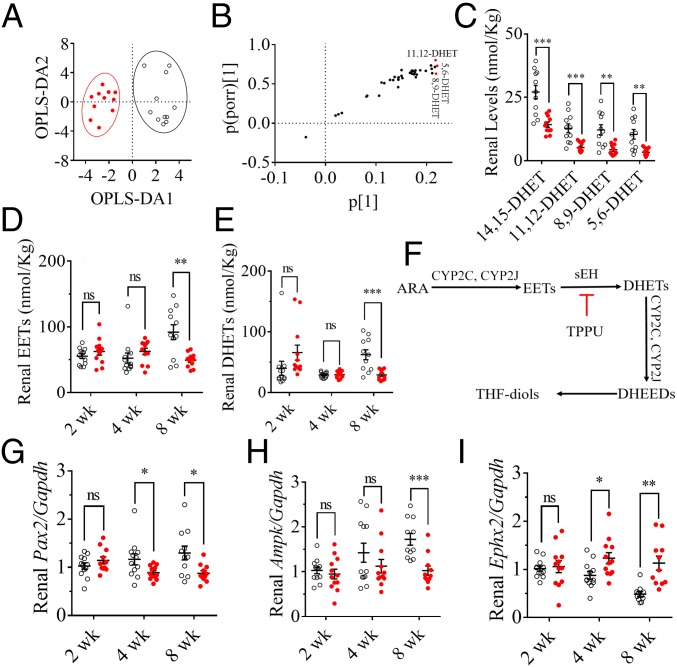
Fig. 1.
An HFD caused murine renal injury involved in the activation of sEH and the inactivation of Ampk and Pax2. (A) A 2D scatter plot for OPLS-DA of the renal LSMs highlights the difference between the mice fed on an HFD (red dots) and a CTD (unfilled circles) for 8 wk. R2X = 0.791, R2Y = 0.780, and Q2 = 0.582. (B) S plot of the OPLS-DA model in A shows that 5,6-, 8,9-, and 11,12-DHET were the three major markers contributing to the discrimination of the mice fed with an HFD and a CTD (the VIP values are presented in SI Appendix, Table S1). (C) The 8-wk intake of HFD significantly decreased renal levels of 11,14-, 11,12-, 8,9-, and 5,6-DHET; the corresponding renal levels of 14(15)-, 11(12)-, 8(9)-, and 5(6)-EET are presented in SI Appendix, Fig. S2E. The renal levels of (D) total EETs [the sum of 14(15)-, 11(12)-, 8(9)-, and 5(6)-EET] and (E) total DHETs (the sum of 11,14-, 11,12-, 8,9-, and 5,6-DHET) were significantly decreased in the mice fed with an HFD for 8 wk but only slightly changed in the mice treated for 2 and 4 wk. (F) A brief scheme of the metabolic pathways for EETs and DHETs. (G) The renal Pax2 were decreased transcriptionally by feeding HFD for 4 and 8 wk. (H) The renal Ampk were decreased transcriptionally by 8-wk intake of HFD. (I) The renal Ephx2 were increased transcriptionally by feeding HFD for 4 and 8 wk; the data for HFD-caused renal injury are presented in SI Appendix, Fig. S2 A–D. The data represent mean ± SEM (n = 11 to ∼12); ns (no significant difference) P ≥ 0.05, 0.01 < *P < 0.05, 0.001 < **P ≤ 0.01, and 0.0001 < ***P ≤ 0.001 were determined by two-tailed t test.

