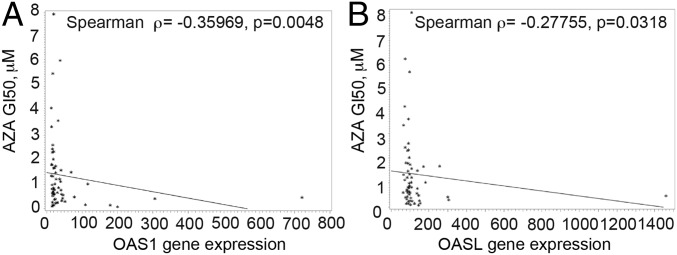
Fig. 6.
Basal OAS1 and OASL expression correlate with AZA sensitivity among NCI-60 tumor cell lines. Drug sensitivity to AZA is represented as GI50, the drug concentration resulting in a 50% growth reduction, quantified by measurement of total RNA at day 6 (raw data were downloaded from the National Cancer Institute Development Therapeutics Program; dtp.nci.nih.gov) (higher GI50 indicates less sensitivity to drug). GI50 was correlated with expression of OAS1 (A) and OASL (B) in the cell lines (gene expression values by microarray from the Gene Expression Omnibus database, accession no. GSE5846). Probe sets were 205552_s_at (for OAS1) and 210797_s_at (for OASL). The statistical method is Spearman’s ranked correlation coefficient test, calculated using SAS v9 software.

