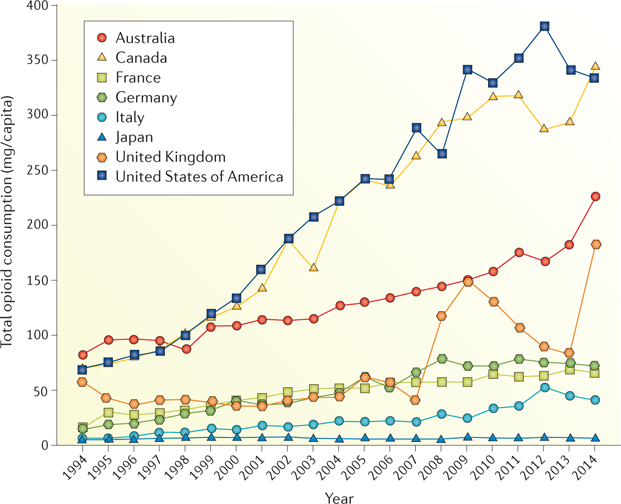
Figure 1. Trends in total opioid consumption by country between 1994 and 2014.

Graph indicates trends in total opioid consumption (mg per capita) per year among some of the world’s most industrialized countries. Figure adapted with permission from REF. 205, Pain & Policy Studies Group, University of Wisconsin–Madison.
