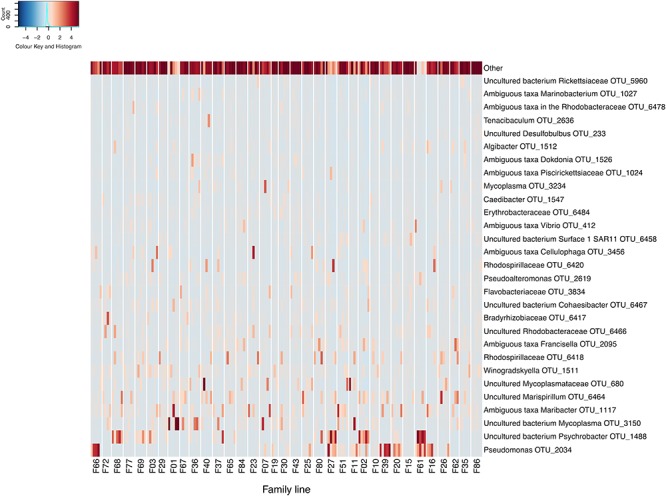
FIGURE 1.

Heatmap of scaled OTU relative abundance for the 30 most abundant OTUs, as well as the remaining summed lowly abundant OTUs. Families ordered by OsHV-1 μvar disease-resistance. Heatmap was made using the R statistical environment using scaled data with the gplots and RColorBrewer packages (Neuwirth, 2014; Warnes et al., 2016; R Core Team, 2017).
