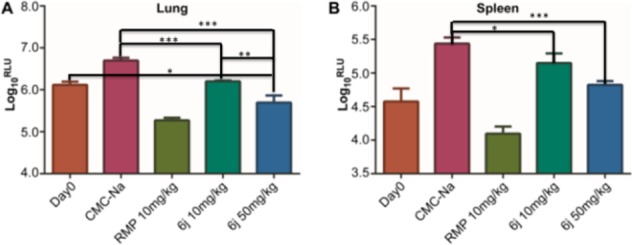
Figure 3.

Mean RLU count (±SD) assessed at day 0 and the day after treatment completion (A) for lung and (B) for spleen. y-axis, corresponding Log10RLU/lung; x-axis, different treatment groups (ns, not significant; *P < 0.05; **P < 0.01; ***P < 0.001).
