
Figure 2:
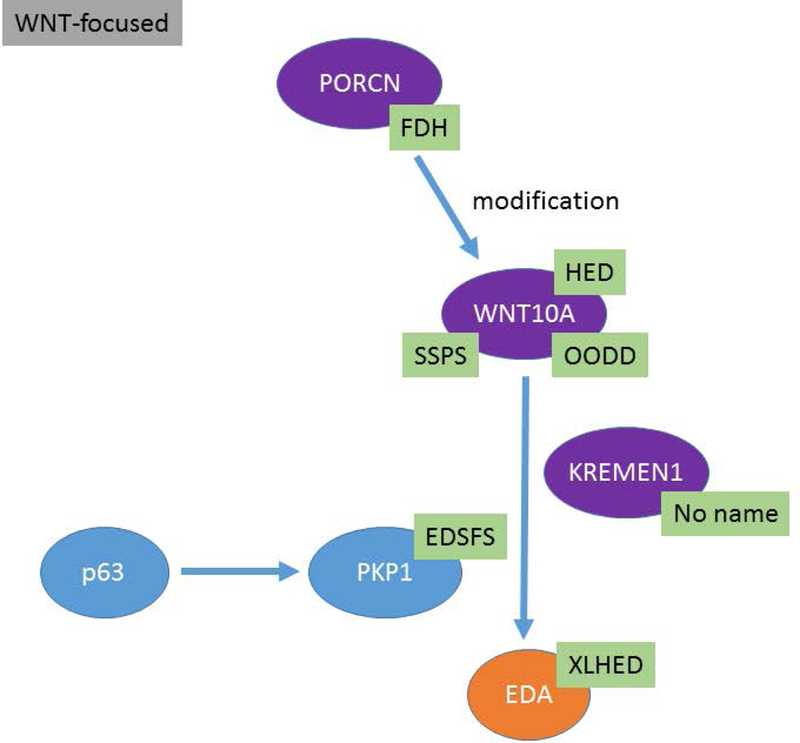
The WNT molecular pathways and the interrelationships between different genes are presented. Causative genes appear in purple ovals and abbreviations for the ED conditions are shown in green boxes.
Official websites use .gov
A
.gov website belongs to an official
government organization in the United States.
Secure .gov websites use HTTPS
A lock (
) or https:// means you've safely
connected to the .gov website. Share sensitive
information only on official, secure websites.
The WNT molecular pathways and the interrelationships between different genes are presented. Causative genes appear in purple ovals and abbreviations for the ED conditions are shown in green boxes.