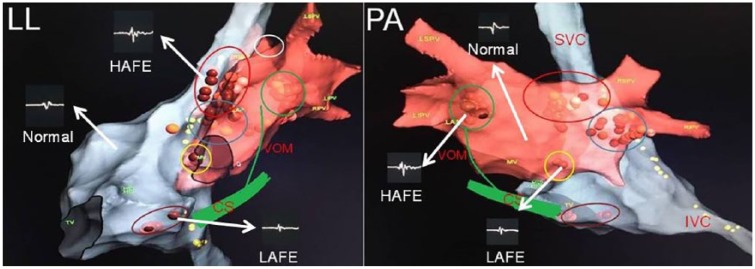
Figure 1.
A modified schematic view of GPs according to animal and human studies. The figure shows the commonly used location sites for GPs and different electrogram patterns seen in atria. Brown dots demonstrate ablation points. Ablation points were selected in the sites revealing high-amplitude or low-amplitude fractionated electrograms. Yellow dots demonstrate phrenic nerve trace by high-amplitude stimulation. Red ellipse demonstrates superior (anterior) right ganglionated plexus. Blue ellipse shows inferior (posterior) right ganglionated plexus. Brown ellipse reveals posterior right atrial ganglionated plexus. Green circle demonstrates posterolateral left ganglionated plexus. Yellow circle reveals posteromedial left ganglionated plexus. Since the vein of Marshall is also rich in parasympathetic neurons, it is added to the figure.
CS, the coronary sinus; HAFE, high-amplitude fractionated electrogram; IVC, the inferior vena cava; LAFE, low-amplitude fractionated electrogram; LIPV, the left inferior pulmonary vein; LL, left lateral view; LSPV, the left superior pulmonary vein; Normal, atrial electrogram demonstarting non-GP sites; PA, postero-anterior view; RIPV, the right inferior pulmonary vein; RSPV, the right superior pulmonary vein; SVC, the superior vena cava; VOM, the vein of Marshall.

