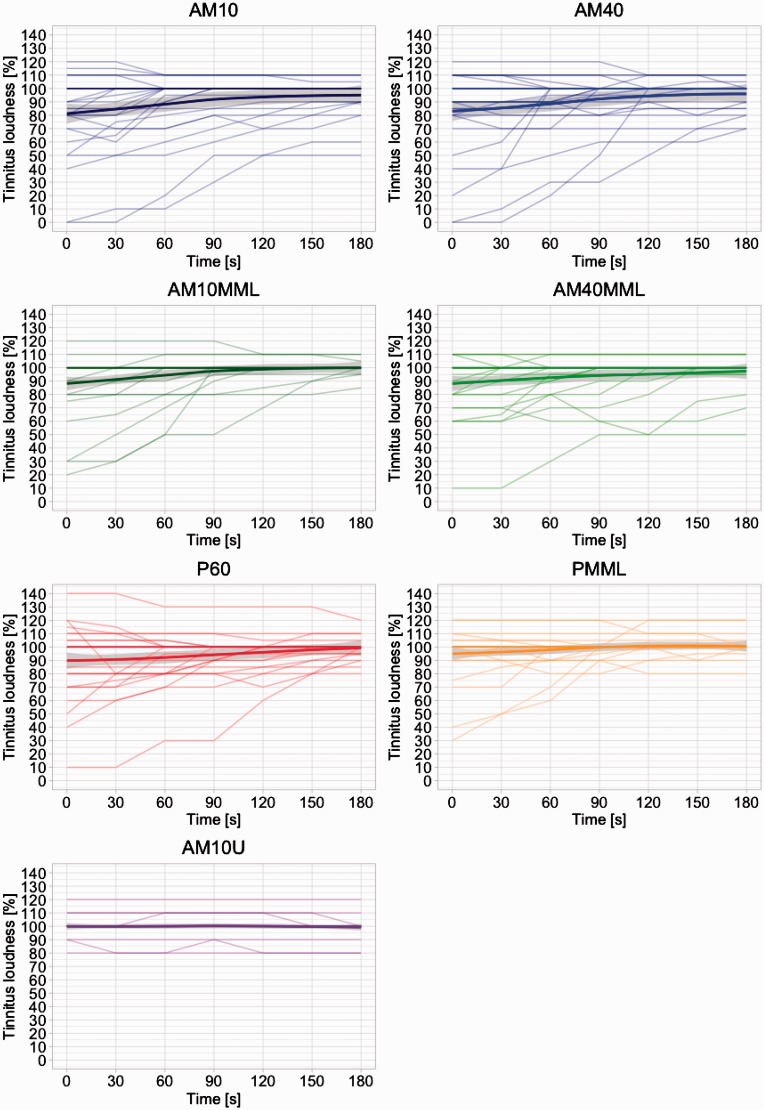
Figure 3.
Tinnitus suppression after stimulus offset for the single stimuli. Each line is representative of a single subject’s tinnitus loudness growth function after stimulus offset at 0 seconds. The mean response and the standard deviation (locally weighted scatterplot smoothing) are plotted as a thick line and a gray ribbon, respectively. Notably, the variability after stimulation offset is considerable while it converges over time as typical in RI (Roberts, 2007).

