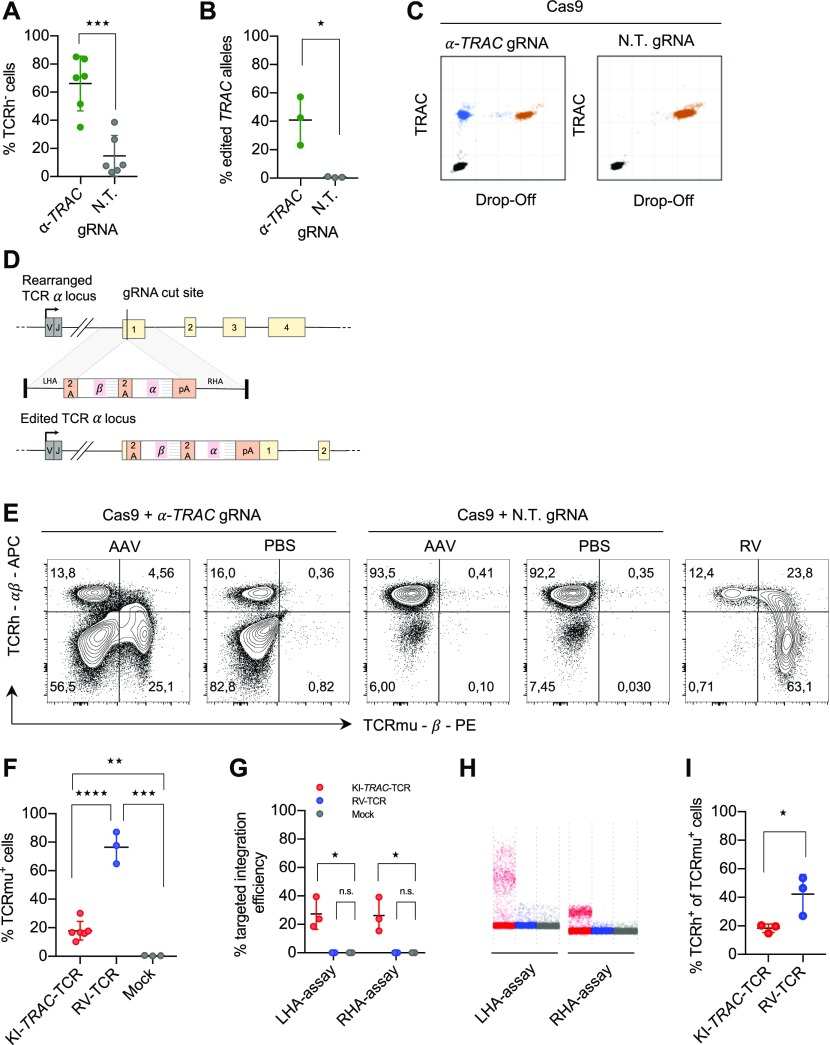
Figure 1. CRISPR-Cas9- and AAV-mediated TCR replacement.
(A) Flow cytometry analysis of primary human CD8 T cells electroporated with RNPs with an α-TRAC gRNA or a non-targeting (N.T.) gRNA at day 7 after electroporation (data represent three donors in two independent experiments, n = 6). (B) ddPCR quantification of the percentage of edited TRAC alleles on day 7 (n = 3 donors) with 10 ng genomic DNA input. (C) Representative ddPCR plots are shown. x and y axes show fluorescence intensity (arbitrary units). (D) Schematic representation of the human TRAC locus (top), the recombinant AAV6 targeting construct encoding the exogenous TCR (middle) and the successfully edited TRAC locus (bottom). LHA, about 900-bp-long left homology arm; RHA, about 900-bp-long right homology arm. (E) Representative FACS plots of primary CD8 T cells electroporated with α-TRAC or N.T. gRNA and transduced with AAV (MOI = 106) or PBS or γ-retrovirally transduced on day 7 after electroporation or transduction. Axes use biexponential scaling. Graphs are 10% contour plots with outliers displayed. (F) Flow cytometry analysis of KI-TRAC-TCR cells (data represent three donors in two independent experiments, n = 6), γ-retrovirally (n = 3 donors), or mock-transduced cells (n = 3 donors). (G) ddPCR quantification of the targeted integration efficiency with assays spanning the left (LHA-assay) or right homology arm (RHA-assay). (H) Representative ddPCR plots are shown. y axis shows fluorescence intensity (arbitrary units). (I, F) Flow cytometry analysis as in (F) (n = 3 donors). Asterisks indicate statistical significance as determined by two-tailed unpaired t test. See also Fig S1.

